
CC7. What Is the Controversy About?

Chapter 7
Controversy about climate change has changed dramatically in the past decades. In Chapter 4 we took a careful look at questions about global warming, examining Dr. James Hansen’s statement that the “globe is heating up.” We saw in chapter 4, through International Panel on Climate Change (IPCC) Reports and the Berkeley Earth Surface Temperature (BEST) project, that there is consensus in the scientific community that indeed the average global temperature has gone up.
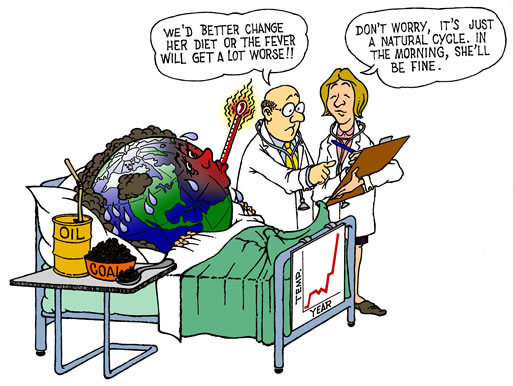
One of the disagreements scientists have about the theory of global warming and the greenhouse effect is whether the warming of Earth’s atmosphere is just a part of the natural climate cycle or the result of human activities. If the warming is part of the natural cycle, then Earth may become cooler on its own. If, however, human activities are responsible, Earth will continue to warm, unless people decide to do something about it—primarily reduce the burning of fossil fuels. But change is not easy.
If scientists show convincing evidence that human-caused global climate change is actually occurring and that it will affect all life on Earth, policy makers—politicians, industry leaders, and social planners, among others—might consider ways of reducing fossil fuel use, and seek alternative energy sources. Policy makers want clear, definite answers. Scientists, however, are skeptics and expressing absolute certainty is not often in the nature of scientific communication.
Scientists often challenge prevailing theories and widely accepted ideas. Even when all the evidence points in one direction, scientists are trained to shy away from absolute commitments, because something may have been overlooked. It seems unscientific to say “I’m absolutely certain,” but quite acceptable to say “I’m 99% sure.” About the best we can expect from scientists is consensus—the agreement of nearly everyone who works in a given field that something is probably true. As we saw demonstrated in Dr. Muller’s study (BEST) in Investigation 4.2, even theories that have wide consensus continue to be revisited as new concerns arise or better methods of analysis are developed. It is the nature of good science.
Good science, with all its uncertainties and controversy, can either inform or cause confusion in political controversy that is needed for societal and governmental decision-making, something we will look more closely at in Chapter 10 – Government Actions. It is important to recognize the difference between scientific controversy and political controversy. Scientific controversy centers on the results of research, data used and methods of analysis. Political controversy centers on the effectiveness of proposed actions and the economic and social impacts of policy decisions. Because science should inform the policy decisions, science is often drawn into political controversy. As a result it is important to be very clear about the scientific consensus and uncertainties before moving into the area of policy. Let’s begin with what is known about global warming.
2015 Feb 27: The U.S. National Academy of Sciences and the Royal Society (United Kingdom) convened a UK-US team of leading climate scientists to produce Climate Change: Evidence and Causes, a brief, readable reference document for decision makers, policy makers, educators, and other individuals seeking authoritative information on the some of the questions that continue to be asked. The publication makes clear what is well-established and where understanding is still developing. It echoes and builds upon the long history of climate-related work from both national academies, as well as on the newest climate-change assessment from the United Nations’ Intergovernmental Panel on Climate Change. It touches on current areas of active debate and ongoing research, such as the link between ocean heat content and the rate of warming. http://nas-sites.org/americasclimatechoices/events/a-discussion-on-climate-change-evidence-and-causes/
I. What Is Known About Global Warming?
Nearly all climatologists agree on each of these points:
- The greenhouse gases currently in our atmosphere absorb infrared energy and are responsible for keeping Earth warm. Without these gases, Earth would almost certainly be in the grip of the deepest ice age in its entire history. Life as we know it would be impossible.
- The concentration of greenhouse gases is increasing. A measurement program started in 1956 along with other studies, show that Arrhenius was correct, and carbon dioxide is building up in the atmosphere.
- The burning of fossil fuels and other human activities are increasing the concentration of greenhouse gases in the atmosphere.
- Theories, experiments, computer simulations, and observations of other planets converge on the prediction that if the concentration of greenhouse gases continues to rise, Earth will warm even more.
II. So What Are the Open Questions?
Controversies, like those reported in the newspaper articles in Investigation 4.1, have been researched and debated by scientists over the past three decades. While many of the questions are substantially resolved, many of the questions are still unanswered. However, government officials and industry leaders still need to decide what to do, even before all the evidence is in. So it’s especially important for them to keep informed about the latest research. To do that, they need to understand what the issues are.
For example, given that the four statements in the previous section are widely agreed upon, it seems reasonable to conclude that human activity is causing the observed increase in temperature, as was implied by Dr. Jim Hansen’s 1988 statement that we investigated in Chapter 4. But some skeptical scientists still ask, “How do we know the current warming is not due to Earth’s natural variations?” There is some scientific complexity, if not outright uncertainty, which we will explore further. It is just one of a number of key controversial questions facing climate scientists and policy makers.
Understanding the questions scientists are trying to resolve is, in fact, important for everyone. Our individual actions may be affecting the climate, and climate change may affect the well being of future generations. Plus, controversy in science provides a fascinating “window” on the nature of science. Key areas of uncertainty and controversy in climate science include these questions:

- To what extent is human activity responsible for heating of the atmosphere?
- When will the concentration of greenhouse gases double?
- How warm will it get when greenhouse gases double?
- Will the change in climate be gradual or rapid?
- How will clouds and oceans affect the changing climate?
- Has the warming caused any noticeable effects so far, and if so, what are those effects?
- To what extent will the effects of global warming impact Earth systems (including life) in the future?
As you read the latest reports on these controversies, imagine you are a government policy maker—a U.S. representative, senator, cabinet member, or even the president of the United States. Based on the latest information, what actions do you think are warranted: strong, moderate, or no action to curb increase in greenhouse gases?
- Strong actions (for example, adding a high federal tax on gasoline and oil to lessen use of fossil fuels, which could result in the loss of jobs by people in those industries and should be counterbalanced by increase in jobs in other industries or services).
- Moderate actions (for example, modest fuel tax increases, putting caps on greenhouse gas emissions while allowing companies to buy and sell their quotas, and/or giving tax relief construction actions such as energy conservation measures and planting trees).
- No action except for continued research.
III. Are natural cycles such as those driven by the Sun responsible for the warming observed in the past 100 years?
Could it be that the Earth’s warming over the past century, is not due to human activities? To answer that, we need to know about Earth’s natural temperature changes. Earth has gone through a number of periods of warming and cooling.
Temperature change for the past 450,000 years
Data derived from ice cores from Vostok: variation with time of Vostok isotope temperature record as difference from the modern surface temperature value of -55.5°C
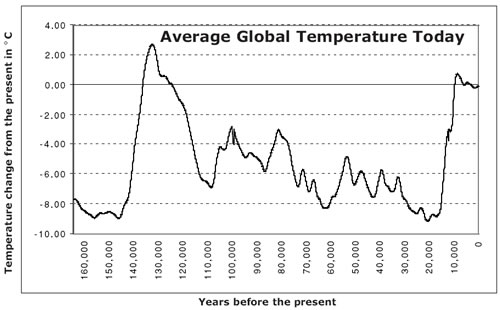
Temperature change for the past 160,000 years
The graphs “Temperature Change for the Past 450,000 Years” and “160,000 Years” above shows Earth’s climate has varied a great deal from natural climate changes. Most of that time it was a lot colder than it is now. The period from about 120,000 to 18,000 years ago, is the most recent “ice age,” also known as a “glacial period.” The average global temperature was at most 9°C colder than it is today, yet ice sheets up to two miles deep covered Canada and northern United States, reaching as far south as what is now New York state. Despite the cold, our ancestors thrived.
About 15,000 years ago Earth started to warm. Gradually, the great ice caps melted and sea levels rose worldwide by as much as 65 meters. The planet reached its current temperature about 10,000 years ago. During the most recent 10,000 years, called the Recent or Holocene Period, agriculture was developed and complex human civilizations gradually arose.
Studies of Earth’s even more distant past indicate there have been 17 warm interglacial periods over the past two million years, with an ice age after each one. This pattern is most likely caused by a regular cycle of changes in Earth’s orbit and the tilt of its axis, known as Milankovitch cycles, named after Malutin Milankovitch, who suggested the theory (see GSS Life and Climate, Chapter 10). In that cycle, Earth will not be entering another ice age until about 30,000 years in the future (IPCC).
But these very long-term cycles that happen over periods of thousands of years cannot explain the warming that has occurred just in the past 100 years. For that, let’s look more closely at how climatologists have determined what temperatures and atmospheric composition was in the past several hundred years.
First, how do they do that? Temperatures were not even directly measured more than a couple of hundred years ago.
Climatologists have developed ingenious ways of determining past temperatures using data we are able to measure directly, like composition of ice in glaciers and polar ice caps. The use of a “stand in” for information that we are not able to measure directly is called “proxy data.” The “stand in,” or proxy data, must change in a known way with regard to the thing we want to measure.

Proxy Data
A very simple example of proxy data would be estimating the number of mice living in an area. If for some reason you are unable to count the mice directly, you can count mice droppings. The amount of mice droppings will increase with the number of mice in the area and a relationship can be determined between the amount of mice droppings and the number of mice. If we determine how many droppings an average mouse produces in a specific period of time, the number of droppings is the proxy data for mice.
Can you think of other examples in which proxy data could be useful?
Proxy data about past climate changes can be found in tiny bubbles of atmospheric gases trapped layers of ice near the North and South Poles and in the composition of the water, itself. Since the ice does not melt in the Arctic and Antarctic regions, older layers are buried by newer layers. Over the past decades, many ice cores have been extracted from the Greenland ice sheet and from the deep ice of Antarctica. Ice cores are cylinders of ice cut by a drill shaped like a long tube. Yearly layers can be seen and can be counted like annual rings on a tree.
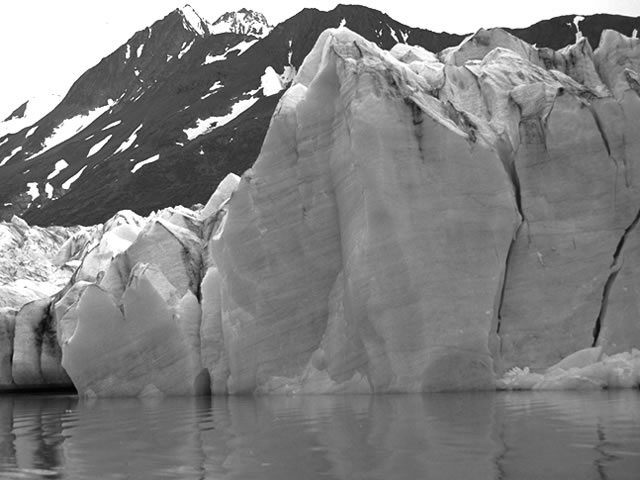
Yearly layers of ice in icebergs can be counted like annual rings on a tree.
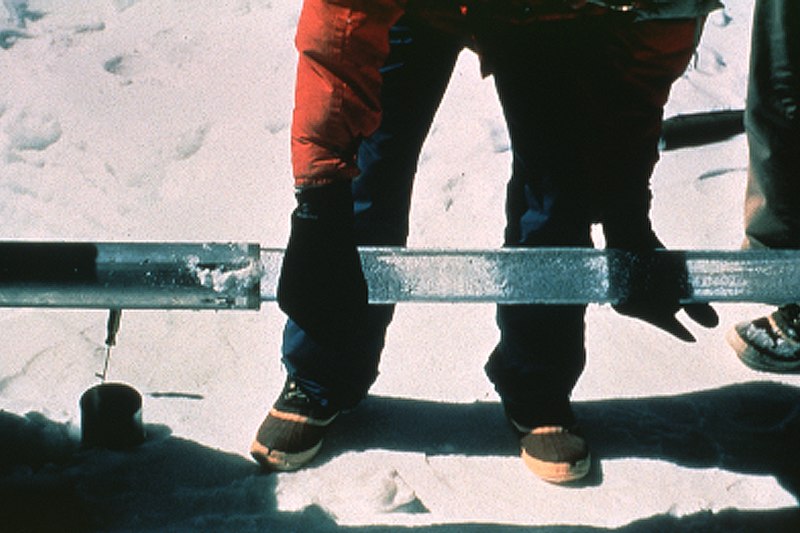
Icecore 4
Photo by Lonnie Thompson, Byrd Polar Research Center, Ohio State University. http://commons.wikimedia.org/wiki/File:Icecore_4.jpg
Ice cores are important in two ways. First, by melting or crushing the ice, the samples of past atmospheric air, especially carbon dioxide, methane, nitrogen, and oxygen, can be released and analyzed. Second, the actual composition of the water can be analyzed in terms of the relative abundance of isotopes of oxygen or hydrogen in the water molecules.
Isotopes are atoms that are chemically the same, but have different numbers of neutrons, so have different atomic weights. A “heavy” oxygen atom (18O) has 18 neutrons in its nucleus , two more neutrons than a normal oxygen atom (16O) has, though either can be part of a water molecule. Similarly water contains hydrogen atoms which can be in any of 3 isotopes: 1H (normal hydrogen), 2H (deuterium), or 3H (tritium).
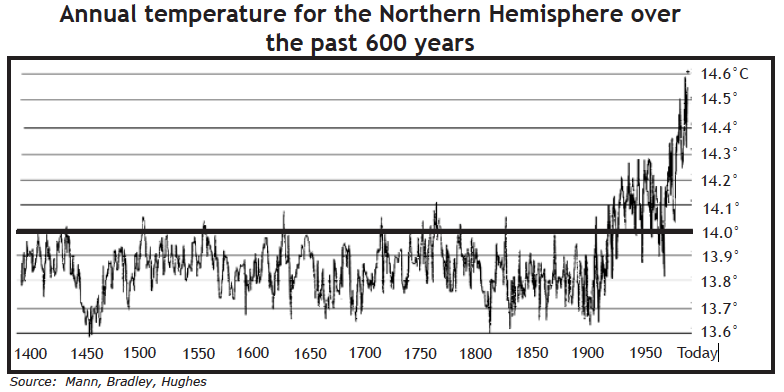
Studies have found that the amount of water with the 18O isotope of oxygen changes with temperature because it differs from the water with 16O in how easily it condenses to precipitate as snow. That’s why the abundance of 18O in a sample of water can serve as a proxy for temperature. A comparison of some of the results of past global temperature determinations by researchers using proxy data gathered different methods is shown in the graph below.
Temperatures for the Past 1000 Years
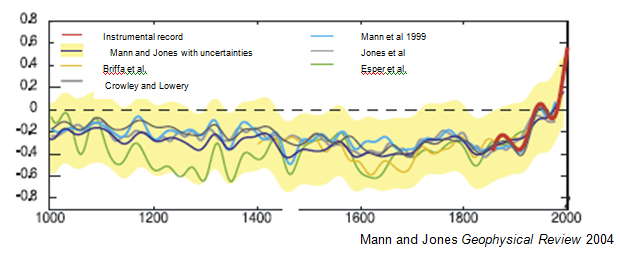
In the graph of temperatures for the past 1000 years, each line on the graph is from a different study, using a different set of temperature-proxy data with different methods of analysis. They show striking similarities:
- The Earth experiences oscillations in global temperature over time.
- There has been a steep increase in temperature since the early 19th century.
- The Earth’s temperature is higher than it has been in the last 1000 years.
- Proxy data measurements closely match recorded temperatures for the past 100 years.
- This is especially important because it makes us confident that proxy data methods are accurate.
Although this graph makes clear that something unusual is happening, we’re still left with the question, “Might the Sun be responsible for the observed temperature increase.” Another part of the answer to that question involves study of the sunspot cycle. A sunspot is an area on the Sun that is cooler than the surrounding area, making it appear dark by comparison.
See NOAA Paleoclimatology Data Sets – https://www.ncdc.noaa.gov/data-access/paleoclimatology-data/datasets
Records of sunspots started in 1610, shortly after Galileo Galilei made his first observations of the Sun with his new telescope. Continuous counts of sunspots since 1849 reveal a regular cycle of sunspot numbers that oscillates from high to low every 11 years. This cycle is seen clearly on the “Sunspot Numbers” graph with one notable exception, the Maunder Minimum, 1645–1715, when very few sunspots were recorded, in a climatic period called the “Little Ice Age.” Temperatures in northern Europe during this time were 0.5 C lower than average.
We now know that increased sunspot activity indicates increased solar activity and greater amounts of solar radiation sent to Earth, heating the planet. The amount of radiation coming from the Sun varies by only 0.1% but the effect is still noticeable on a large scale. In recent years, ice cores in both northern and southern hemispheres have confirmed the 11 year cycle. When this cycle is matched up with data about global temperatures, we see a strong relationship between the two: average global temperature varies directly with sunspot activity.
With the understanding of the relationship between sunspots and global temperature in hand, can we answer the question of whether or not something unusual is happening with our Sun that might be contributing to increased global temperatures in the present. The results of one such study were published in the journal Nature and are summarized in the graph below. The results of this study show that although the 11 year sunspot cycle continues, we have been experiencing a period of unusually high solar activity.
Sunspot Numbers vs. Time
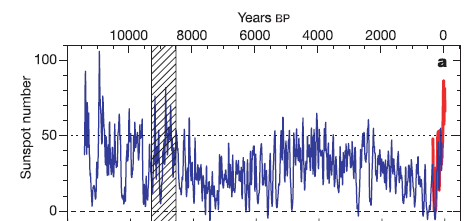
This graph of sunspot numbers over time was taken from research by Solanki et al. (2004). The red line is observed sunspot number over the last 400 years, the blue line the estimated sunspot number from their C-14 tree ring data (proxy data) over the last 11,400 years.
Other groups are working on improving estimates of historic sunspot numbers, but it appears that the solar cycle may be contributing to global warming of the last century. But how much? Does it account for all of the temperature increase? This question is still being investigated and is a point of controversy.
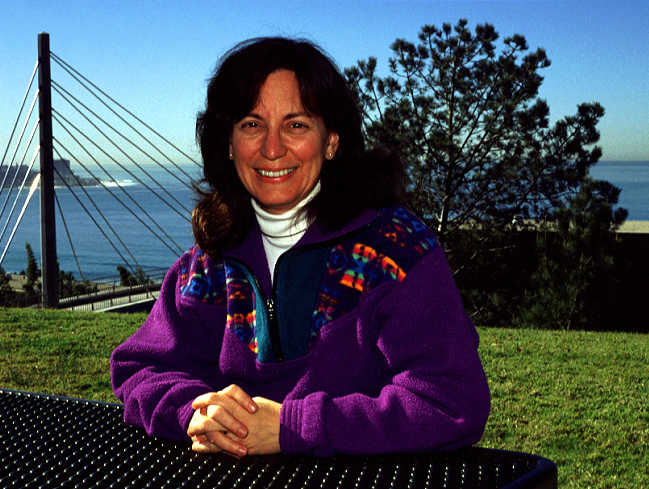
In the late 1990s, Dr. Sallie Baliunas from Harvard University’s Center for Astrophysics, argued that that most of the climate change observed in the 20th century century, over 90% of it, was due to changes in the Sun’s activity.
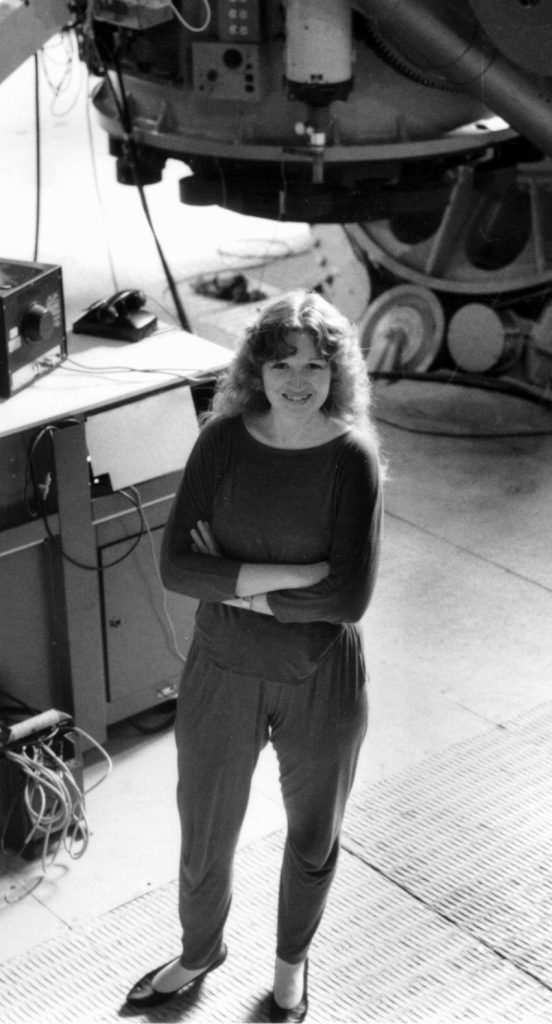
Sallie Baliunas at Mt. Wilson Observatory.
Photo courtesy of Sallie Baliunas.
Baliunas argued that changes in solar activity affect Earth’s climate, causing changes in the paths of storms, and the amount of cloud cover, rain, and snow, which in turn affect the planet’s overall global temperature. Support for that theory came from deep in an ice core taken from the Greenland ice sheet, from time back to more than 160,000 years ago. A greater concentration of dust of dust in some layers suggested there must have been storms that year that carried the dust from areas where there was no snow to the Greenland ice sheet, and the concentration of dust varied with an 11-year cycle.
More recent estimates for the contribution of increased solar activity on current global warming have ranged from less than 5% to as high as 25%. More study is needed, but indications are that global warming cannot be explained without a large impact from greenhouse gases. Current levels of carbon dioxide gas in the atmosphere are higher than at any time in the past 420,000 years (Petit; see Bibliography).
Baliunas’ argument about contribution of solar variations to climate change cultivates our desire to understand what other factors besides CO2 concentrations may be factors in climate change and why the global climate cooled slightly from 1940 to 1970.
This decrease cannot be explained by an increased greenhouse effect, which would predict a continuous increase in temperature since the industrial revolution. Is solar variability the dominant cause or is something else to blame?
Sulfur trapped in the Greenland Ice Sheet, 1900–2000.
As important as the greenhouse effect is, it is not the only cause of climate change. Both natural and human factors can cause global cooling. Industrial and volcanic activities emit large amounts of sulphate aerosols (very tiny particles suspended in a gas) into the atmosphere that reflect energy back into space, cooling the atmosphere. Evidence of sulfur concentrations in Greenland ice cores points to the industrial boom after World War II causing rising global concentration human-produced aerosols in the atmosphere. The rise that is reflected in ice core records drops off in the early 70’s when the US and Europe enacted strong clean air regulations. CO2 emissions continued to rise throughout that time period.
Computer models are not able to replicate the observed cooling between 1940 and 1970 without factoring in aerosol concentrations along with solar variability and CO2 concentrations. Once again we see how vigorous scientific debate reveals the complex interactions that contribute to global climates and the difficulties associated with explaining short term changes in global temperature.

CC7.1. Investigation:
Keeping the Facts Straight
Use evidence to support or qualify a claim.
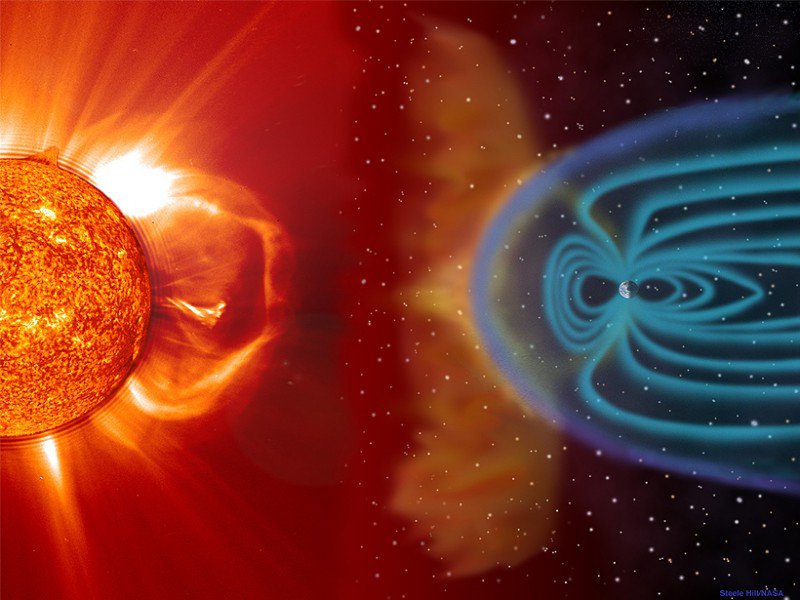
The solar cycle can impact the Earth’s climate through solar radiation and energetic particles.
Energetic particles emitted by the Sun interact with the Earth’s magnetic field (depicted above, not to scale) and can precipitate into the Earth’s atmosphere.
Credit: Steele Hill/NASA
2015 Dec 7: From the article Model of Solar Cycle’s Impact on Climate Gets Upgrade by Mark Zastrow, EoS Earth & Space Science News:
…Over the course of the 11-year cycle, the rotation of the Sun slowly twists its magnetic field into knots, creating dark sunspots. Although the overall brightness of the Sun varies by only 0.1%, the twisted bundles of magnetic energy can boost its ultraviolet (UV) radiation by 4%–8% at the solar cycle’s peak. These powerful UV rays trigger chemical reactions in the stratosphere that bind oxygen atoms and molecules to form ozone. Since ozone itself is a good absorber of UV radiation, it can heat the stratosphere near the equator, which affects the winds that circle the globe. Increased solar activity also excites Earth’s magnetic field, sending high-energy particles hurtling into the upper atmosphere. During the long polar night, this can generate large amounts of the nitrogen compounds nitric oxide (NO) and nitrogen dioxide (NO2), which eventually descend into the stratosphere and destroy ozone. To study the effects of these often-competing processes, scientists construct simulations using models such as the Whole Atmosphere Community Climate Model (WACCM) produced by the National Center for Atmospheric Research….
IV. To what extent is human activity responsible for heating of the atmosphere?
Let’s revisit the controversial question that follows from the 1988 statements made by Dr. James Hansen. Are humans responsible for global warming?
Though we do not know precisely how much of the atmospheric warming observed in the past 100 years is due to the increase in greenhouse gas concentrations, scientific consensus has human generated greenhouse gases at center stage. One indicator of the growing consensus can be seen in the conclusions from the International Panel on Climate Change (IPCC):
1990 First Assessment Report
- “…emissions from human activities are substantially increasing the atmospheric concentration of greenhouse gases and that this will enhance the greenhouse effect and result in additional warming of the Earth’s surface. “
1995 Second Assessment Report
- “… greenhouse gas concentrations have continued to increase.”
- “… the balance of evidence suggests a discernible human influence on global climate.”
2001 Third Assessment Report
- “There is new and stronger evidence that most of the warming over the last 50 years is attributable to human activities.”
- “Global average temperature and sea level are projected to rise under all IPCC scenarios.”
2007 Fourth Assessment Report
- Warming of the climate is unequivocal, as is now evident from observations of increases in global average air and ocean temperatures, widespread melting of snow and ice, and the rising average sea level.
- Most of the observed increase in global average temperatures since the mid-20th century is very likely due to the observed increase in anthropogenic greenhouse gas concentrations.
2013 Fifth Assessment Report
- It is extremely likely that human influence has been the dominant cause of the observed warming since the mid-20th century. The atmospheric concentrations of carbon dioxide (CO2), methane, and nitrous oxide have increased to levels unprecedented in at least the last 800,000 years. CO2 concentrations have increased by 40% since pre-industrial times, primarily from fossil fuel emissions and secondarily from net land use change emissions.
- Ocean warming dominates the increase in energy stored in the climate system, accounting for more than 90% of the energy accumulated between 1971 and 2010.
- Limiting climate change will require substantial and sustained reductions of greenhouse gas emissions.
- Most aspects of climate change will persist for many centuries even if emissions of CO2 are stopped. This represents a substantial multi-century climate change commitment created by past, present and future emissions of CO2.
Other 2013 IPCC conclusions concerning consequences of global warming, such as sea level rise, ocean acidification, shrinking glaciers, shrinking polar ice, and weather changes are in chapter 8.
CC7.2. Investigation:
How Have IPCC Reports Changed?
Although the IPCC reports cover much more than whether or not humans are responsible for global warming, it is helpful here to take a close look at how statements in this area have changed over the years:
- Make a list of words or phrases the IPCC uses to describe what is responsible for warming. How have these words changed?
- In your opinion what is the strongest word or description the IPCC uses.
- Find examples from the statements where the IPCC switches from predicting what will happen to what has happened (has been observed).
See also: this animation on the possible explanations for global warming.
The reports make increasingly strong statements about human or anthropogenic contributions to climate change but the reports acknowledge areas where consensus has not been reached. Most of these areas are connected with predicting the future of climate change which we will examine next.
V. When Will the Concentration of Greenhouse Gases Double?
The concentration of carbon dioxide in the atmosphere is increasing at the rate of half a percent per year. That’s barely noticeable. But if that rate continues, about 100 years from now there will be twice as much carbon dioxide in the atmosphere than there was before the industrial revolution. Other greenhouse gases (methane, nitrous oxides, and CFCs) contribute another half a percent per year in equivalent heat-trapping capacity.
The IPCC report envisions various scenarios, or possible futures. According to some scenarios, increasing world population will cause the amount of greenhouse gases in the atmosphere will grow even faster than it is growing now. As world population increases, so does the demand for food, energy, and manufactured goods. Much of this population growth is taking place in developing nations. As the people in these nations strive to have the same standard of living enjoyed by most people who live in industrialized nations, the amount of greenhouse gases in the atmosphere will increase even further. According to these projections, it seems likely that in the decades to come there will be even more greenhouse gas emissions than now. Moreover, the destruction of rain forests, which is occurring around the world at an increasing rate, means that fewer trees will be around to absorb large quantities of carbon dioxide.
Other scenarios are more optimistic. If energy use can be cut back through conservation, less fossil fuels will be burned, and greenhouse gas emissions will be reduced. For example, new conservation technologies are being developed to light and heat homes in ways that use less energy; and cars are being developed that use gasoline more efficiently.
Then there is the growth of non-fossil fuel energy industries, including wind, solar, nuclear and geothermal power plants that do not emit greenhouse gases. It is also possible that Earth’s natural systems will adjust and the climate will not change significantly, even if the concentration of carbon dioxide continues to increase.
According to the IPCC report, “most emission scenarios indicate that, in the absence of mitigation policies [steps to reduce emissions], greenhouse gas emissions will continue to rise during the next century and lead to greenhouse gas concentrations that by the year 2100 are projected to change climate more than that projected for twice the pre-industrial concentrations of carbon dioxide.”
VI. How Warm Will It Get When Greenhouse Gas Concentrations Double?
It’s difficult to imagine what life will be like in five years—let alone in 30, 40, or 50 years. Perhaps it’s appropriate to take a moment to reflect on the interconnectedness of science with our everyday lives. If we take the predictions of climatologists seriously, we realize more than ever that our actions or inaction today will affect the lives of future generations, children and grandchildren. The ability to predict change is at the heart of current scientific uncertainties and those uncertainties can lead to policy controversies.
“We are looking ahead, as is one of the first mandates given us as chiefs, to make sure and to make every decision that we make relate to the welfare and well-being of the seventh generation to come…
Where are you taking them? What will they have?”
—Oren Lyons, Chief of the Onondaga Nation
It is helpful to keep in mind that, although climate change prediction has inherent scientific uncertainty, there is another related issue where there is more certainty: the amount of fossil fuels powering a large part of our society and world economies is in limited supply. How soon sources of fossil fuels run out and are completely replaced by sustainable alternative energy sources is a subject in the GSS Energy use book, but play an integral role in solutions to any problems associated with climate change. In other words, solutions to society’s energy problems are also solutions for climate change problems.
Predictions of future climates are currently in the form of computer models that predict warming as greenhouse gases continue to increase, and possible effects that result from the warming. Scientists construct computer models to understand things they are not able to analyze in a laboratory. Models have become more accurate as computers have become more powerful over the years. In addition to needing computers that can handle large, complex programs, climate models need accurate descriptions of as many factors that control climate in order to make accurate predictions. Just like a video game programmer needs detailed information about how people walk in order to create realistic graphics, climate models need detailed information about how the Earth’s climate system works.
Climatologists try to make their models more realistic by including more factors. Early on, the effect of aerosols—particles in the air emitted by cars and factories were included in models. Unlike the invisible greenhouse gases, aerosols are visible. Their effect on climate is much like a cloud of ash from a volcano. Aerosols cool the earth by reflecting some of the Sun’s light back into space. The result is that instead of a 5°C increase expected by Arrhenius, only a 1° to 3.5°C increase in temperature is expected with a doubling of greenhouse gases in the atmosphere.
Predicting how warm it will get is very difficult. Imagine a time—perhaps when our children are grown—when new sources of power are developed which are “clean.” They do not produce either greenhouse gases or aerosols. Although aerosols have short lifetimes, since the particles settle within a few years, greenhouse gases hang around for a very long time—as much as 500 years in the case of carbon dioxide. With the cooling effect of the aerosols gone, the atmosphere could heat very rapidly in less than a decade, causing even greater climate disruptions. Over the years, research in new areas such as the exchange of heat between the oceans and the atmosphere and the role of ocean and clouds add more detailed information into computer models, so presumably more accurate information comes out.
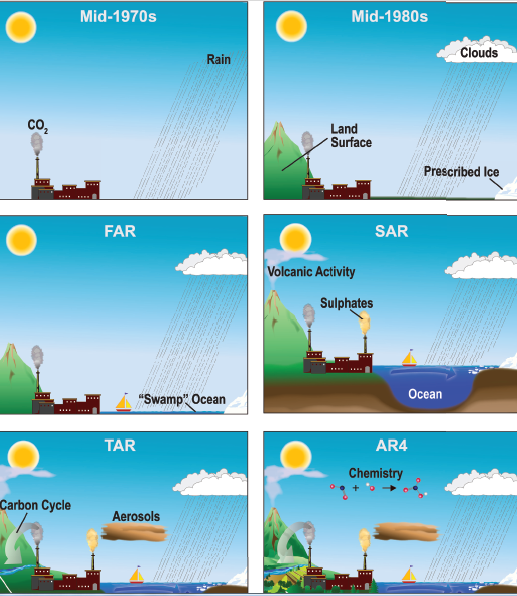
Factors that have been added in climate models over the years.
The pictures below depict factors that have been added to computer models over the years:
the mid-70’s, mid-80’s, the First IPCC Assessment Report (FAR; 1990), Second Assessment Report (SAR; 1995), Third Assessment Report (TAR; 2001) and the Fourth Assessment Report (AR4; 2007).
We can test the precision of computer models by having them “predict” conditions in the past. Today’s computer models are getting better and better at describing past conditions.
When carbon dioxide levels double, many climate models predict that the consequences will be devastating and irreversible in the near term. Knowing when doubling is likely to happen and how high the global temperatures will go affects the urgency of policy changes and the amount of financial sacrifice individuals and nations are willing to tolerate.
To address this, the IPCC has developed several different scenarios which it refines with each new report as computer modeling is perfected. Using the best physical modeling available, the modelers enter different factors that depend upon human dependent changes, primarily population and use alternative sources of energy. Each scenario gives a different answer for the question of carbon dioxide doubling time and temperature increase.
Multimodel Averages for Surface Warming
Summary for Policymakers IPCC Working Group 1 2007
This graph summarizes the results of each of the scenarios reported in the Fourth Assessment Report in 2007.
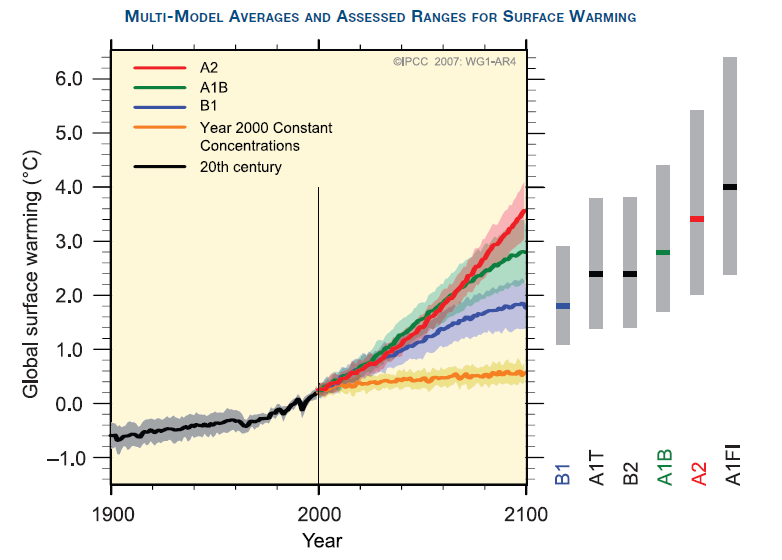
It is somewhat discouraging that no scenarios lead to stable global temperatures. If carbon dioxide emissions are halted at the year 2000 levels, temperatures will continue to increase. But it’s also important to remember that our actions can determine the rate of average global temperature rise.
See also
- Climate Modeling 101 website at National Academy of Sciences. http://nas-sites.org/climatemodeling/
- Simplified Climate Models by Scott Denning et al, Colorado State University BioCycle. For GSS Climate Change chapter 7. Examples are CO2 and Climate Calculator; Terrestrial Carbon Cycle; Earth Carbon; … full list: http://biocycle.atmos.colostate.edu/toy-models/
- The NASA Earth Exchange Global Daily Downscaled Projections (NEX-GDDP) dataset [announced 2015 June 9 in NASA release 15-115], derived from General Circulation Model (GCM) runs conducted under the Coupled Model Intercomparison Project Phase 5 (CMIP5) and across two of the four greenhouse gas emissions scenarios known as Representative Concentration Pathways (RCPs), in support of the Fifth Assessment Report of the Intergovernmental Panel on Climate Change (IPCC AR5).
VII. How Will Clouds and Oceans Affect the Changing Climate?
Clouds
If Earth becomes warmer because of the greenhouse effect, more water will evaporate from the oceans. Increased water vapor means more clouds, and clouds are very effective at reflecting sunlight. (Just think of the cooling effect of a cloud passing overhead on a hot day.) On the other hand, clouds can also warm Earth. Anyone who lives in the desert knows that you must dress warmly at night because the land cools off very rapidly. But if there are clouds overhead, they will absorb some of the heat radiated by Earth and send it back toward the ground. The only way to determine for sure how to enter clouds into the models is to study their effects in different parts of the world and in different seasons.
The study of clouds is a very active area for researchers today. Ali Omar is involved in a research project designed to answer some of these questions. He is one of the researchers studying the effects of clouds from a satellite launched in 2006. Named CALIPSO, the satellite is a joint project of the United States and France. It is equipped with a laser pointed towards Earth’s surface. The satellite measures laser light that is reflected from cloud layers to determine where the cloud layers are located and how thick they are. It also measures infrared (heat) energy radiated into space. Scientists expect that data from the satellite and from ground-based measurements will enable them to determine whether the overall effect of the clouds is to cool or warm Earth’s surface.

Ali Omar is assistant professor of Physics at Hampton University in Hampton, Virginia. When he was a young boy in Kenya he wanted to be a pilot, but his parents would not let him because they thought it was too dangerous. So, he decided he would learn how to build jet engines instead. He came to the United States to study aeronautical engineering. One of his required courses concerned how jet exhausts affect the atmosphere. That sparked his interest in environmental science. “Now,” he says, “I’m kind of glad my parents did not allow me to become a pilot.”
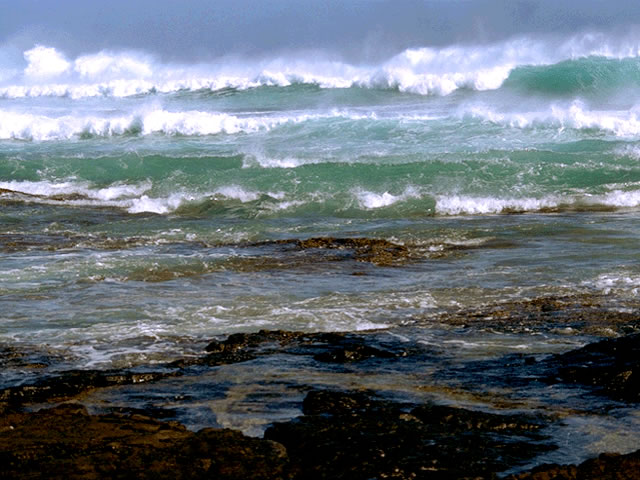
Oceans
Lynne Talley is a researcher at Scripps Institution of Oceanography in La Jolla, California, where she studies the role of ocean circulation in climate. She explained the importance of her research by posing an interesting question: “In February, you would not want to go swimming off the coast of Labrador (north of New England).
The ocean surface temperature is only about 1°C. But Ireland is the same distance north of the equator, and water there is a much warmer 10°C. Why are they so different?” The difference, she said, is due to ocean currents. Labrador is bathed in frigid waters that come from the Arctic, while the coast of Europe is warmed by currents that come from the equator.
Talley said the temperature of the ocean changes far less than the temperature of the land. That affects the interaction between ocean circulation and world climate on different time scales, from a single day to hundreds of years. Let’s start with daily changes. In the daytime the land heats quicker than the ocean, so the air above the land is warmer than the air above the ocean. Warmer air is less dense than cool air. Differences in air density can give rise to air movements. In some locations the difference is great enough for cool sea breezes to move landward, pushing the warmer air upward. At night the land cools off quickly, cooling the air just above it. When the air over the land becomes colder than the air over the sea, the winds reverse.
This description of how winds are created by the relative warming of land and sea also applies to the far stronger seasonal changes in Asia referred to as monsoons. In the summertime the land mass in Asia stays warmer than the sea. So, moist air moves from the ocean toward the land, bringing life-giving rains. In the winter, the ocean is warmer than the land, so the winds reverse, and people who live in Asia experience hot, dry weather.
In order to predict the future of climate change, researchers are studying the ways that the ocean interacts with the atmosphere.
Changes also occur every few years. The most intensively studied of those is El Niño—a weather condition in the Pacific Ocean that occurs every four to seven years. (El Niño means “The Child” in Spanish. It refers to the Christ Child since these weather conditions always occur around Christmas time.) During El Niño, normal winds and ocean currents reverse for several months, and extreme weather conditions can occur at other places in the world, ranging from droughts, forest fires, and floods to changes in the monsoons and trade winds.
It is estimated that the 1982–83 El Niño event caused $8 billion dollars in damage and the death of 2,000 people worldwide. Estimates of the impact of the 1997–98 El Niño season are even greater, with property damage estimated in the $30 billion to $60 billion range, and as many as 21,000 lives lost (see Mackenzie in the Bibliography). While the cause of El Niño events is still not understood, scientists have determined that it involves the interaction of the ocean and atmosphere systems.
Over a period of hundreds of years, the ocean transports both heat energy and dissolved carbon dioxide in a current so huge it weaves through all of the world’s oceans. It is sometimes called the “global ocean conveyor belt.” Part of the driving force for this current is in the North Atlantic where salty water (which is already denser than fresh water) cools and becomes even denser. The cold, salty water sinks and begins a very long, deep journey around the world (as shown in the diagram on page 24) until it finally wells up somewhere in the Indian and Pacific, and maybe even around Antarctica. As it becomes part of a warm surface current, the water absorbs heat from the Sun and carbon dioxide from the air before it again sinks to the bottom of the Atlantic, several hundred years later. As pointed out by Talley, the precise course of the current is not thoroughly understood. However, the overall idea of long-term ocean circulation is well accepted by nearly all oceanographers
Some scientists are concerned global warming might cause enough melting of the Arctic and Greenland ice sheets for fresh water to flood the Atlantic, slowing or stopping the global conveyer belt. Some researchers reported evidence that the global conveyer belt had, in fact, stopped or weakened at least twice since the last ice age, suggesting that this may occur again if melting of the Arctic and Greenland ice sheets increases (see Ruhlemann in the Bibliography).
Until we have a better understanding of how the clouds and oceans interact with the atmosphere, we will not be able to predict accurately how much our planet will warm if the concentration of greenhouse gases doubles.
VIII. Will the Change in Climate Be Gradual or Rapid?
Analysis of layers of ice in Greenland provides an answer to this question. The record in the ice shows Earth started to emerge from the last ice age about 15,000 years ago. Then about 12,900 years ago, it suddenly cooled again. In the relatively short period of about 10 years, the temperature plunged 15°C, returning almost to ice-age temperatures. The cold period lasted for 13 centuries, until about 11,600 years ago, when, in just about a decade, Earth finally started to warm again. It has been relatively warm ever since. This cold period was also observed in the analysis of layers of ice from Antarctica, but was not quite so intense.
Why did the climate change over just one decade, then remain cold for 13 centuries, only to warm rapidly again? Scientists do not have certain answers to this question, but one popular theory is that the deep ocean current was “switched” off, and then “switched” back on again 13 centuries later. Here’s how it may have happened.
The Global Conveyor Belt
A theory of how water circulates through the world’s oceans over a period of several hundred years.
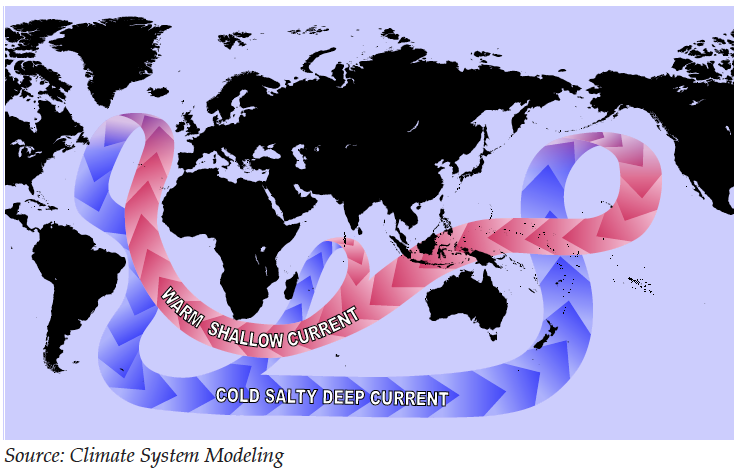
We know the conveyor belt current makes a huge difference in the climate, and it is driven by changes in the temperature and salinity (saltiness) of the seawater. If the climate warmed too quickly, the warmer temperature could have caused a glacier to melt, flooding the North Atlantic with fresh water. The fresh water would float on top of the denser salty water, and stop the conveyor belt current from flowing. For the global ocean current to be “switched” back on, the ocean would have to become salty again. This could happen as the world cools in an ice age and less fresh water is added to the ocean. Eventually the ocean would become salty enough for the current to start flowing again and warm temperatures to return.
While we don’t know for certain what will happen in the future, we do know abrupt changes in climate have occurred in the past, suggesting that they may occur in the future. There are some indications of changes in ocean salinity and temperature already being reported, which we’ll see more in the next chapter (8).
CC7.3. Investigation: State of the Climate
Visit the National Oceanic and Atmospheric Administration (NOAA) website on “State of the Climate” at http://www.ncdc.noaa.gov/sotc/
Look at latest information about particular climate factor(s) such as temperatures, precipitation, ice and snow, drought, and/or storms. Compare with the same factor(s) in prior time period(s). Write about your findings and conclusions and share with your teacher and fellow students.
~~~
CC7.4. Investigation: American Geophysical Union Position Statement on Climate Change—revised August, 2013
Read the position statement on climate change from the American Geophysical Union (AGU): Human-induced climate change requires urgent action (2013). Here are some questions to consider as you read or after you have read the statement:
- Will effects of climate change be uniformly manifested throughout the world?
- What uncertainties remain about climate change?
- What factor is the dominant cause of current trends of climate change?
Now, how about the last two questions in our list of active scientific questions:
- Has the warming caused any noticeable effects so far, and if so, what are those effects?
- How will life on Earth be affected by global warming?
Those are subjects for Chapter 8, What Are the Consequences of Global Warming?
See also:
- The SkepticalScience page: Global Warming & Climate Change Myths (sorted by recent popularity vs what science says). http://www.skepticalscience.com/argument.php
- Movie: Thin Ice – gives students the chance to see the astonishing range of human activity as well as scientific endeavor that required to understand our changing climate. The movie visited researchers on 4 continents and the ocean as they studied the changes in the atmosphere, oceans and ice sheets through measurements (from instruments, satellites, ice and rock) and computer modelling. http://thiniceclimate.org (Download costs $14 – as of Sep 2013)
Timeline below is from https://imgs.xkcd.com/comics/earth_temperature_timeline_2x.png
