
LC10. The Ice Ages
Chapter 10
I. The Climate Record
During the Cretaceous period, the dinosaurs enjoyed a climate much warmer than we have today; however, other periods were much colder than it is now. In recent years paleoclimatologists (scientists who study past climates during the Earth’s history) have gathered evidence of ice ages and developed reasonable theories to explain their causes. A number of factors caused each of the ice ages and the warmer periods between them. The list on the next page identifies the major ice ages, and one or two of the leading theories of why they occurred.
| Approximate Dates | Modern Theories of the Major Ice Ages |
| 2.4 – 2.2 billion years ago | The first living cells absorbed carbon dioxide, which lowered the concentration of that gas in the atmosphere. Since carbon dioxide is a greenhouse gas, the global climate cooled. |
| 750 – 580 million years ago | The coldest ice age, sometimes called “snowball Earth,” occurred after the supercontinent Rodinia broke apart. A chain of events reduced carbon dioxide in the atmosphere. The climate warmed intermittently when repeated volcanic eruptions increased carbon dioxide in the atmosphere. 750—580 million |
| 440-430 million years ago | The evolution and spread of land plants may have caused an ice age. Plants absorb carbon dioxide. With less carbon dioxide in the atmosphere, the greenhouse effect was reduced and global temperatures dropped. |
| 300-260 million years ago | At least four ice ages occurred near the end of the Carboniferous and the beginning of the Permian period. The first one started when ice sheets on a massive land mass positioned over the South Pole reflected a large portion of the sunlight into space, which decreased the heating of the South Pole. |
| 33 million to 11,000 years ago | Cooling began when continents collided, resulting in the build up of mountain ranges and plateaus. Then Antarctica drifted over the South Pole, allowing ice sheets to form and reflect sunlight into space. Finally, in the last three million years, it became cool enough for minor variations in Earth’s orbit to cause the most recent series of ice ages. |
II. Evidence of Past Climate Change
“To understand the present we must remember the past” is the saying of the historian. In science, too, one of the best ways to comprehend the times in which we live is to study the past. To study the history of the Earth’s climate, scientists leave their classrooms and laboratories. They climb mountains, go to sea, travel to the North and South Poles, and visit the very bottom of the ocean.
For over one hundred years, scientists have known that the climate has not always been like it is today. Recent ice ages have left their mark on the landscape. Glaciers carved deep valleys, such as Yosemite in California, and polished smooth rocks in the Adirondack Mountains in New York. The rivers of moving ice carried tons of rounded rocks and huge boulders, too heavy to have been transported by rivers and streams, hundred of kilometers from their point of origin. These features of the landscape helped scientists mark the path of past glaciers, but these signs of past glaciers do not tell us when or why ice ages occurred.
Putting together a record of past climate changes is a challenging undertaking. Nobody was around to take measurements. The only witnesses are the silent rocks, glaciers, and ocean sediments. Teasing information out of them has been the work of many investigators, using different tools and techniques. Just as historians have learned to read the dead languages of the past, scientists have learned to read the record left in layers of sediment at the bottom of lakes, in fossil remains in the depths of the ocean, and in layers of ice laid down winter after winter.
In this chapter we’ll visit some of the coldest places on Earth to find out how today’s paleoclimatologists read the record of past climates that is locked in glaciers. First, we will look at methods that were developed by some of the earlier paleoclimatologists. These methods provided the first glimpses of earlier climates. When modern methods of climate determination were later invented, the older techniques supplied a way to confirm the results and helped scientists develop confidence in their new approaches.
Tree rings and climate
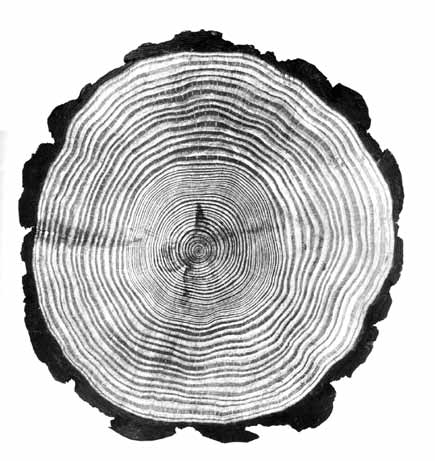
As part of a tree’s growth, a new layer or ring of cells is added to its trunk each year. The number of rings, then, represents the number of years the tree has been alive. During spring and summer, in temperate climate regions, water and nutrients are available to enable a tree to grow. Long, wet summers are better for tree growth than cool, dry summers. During the winter months when water and nutrients are typically frozen or unavailable, trees in the temperate zone do not grow. Thus, by observing the rings of a tree we see the pattern of each year’s growth and can make conclusions about the growing conditions: thicker rings represent better growing seasons than do thinner rings. In this way, the rings of a tree provide a record of the climate in the region where the tree lived, during the time that the tree was alive.
The oldest trees in the world are the bristlecone pines in the White Mountains of California. These trees can live about 5,000 years. Most trees, however, live for only dozens or hundreds of years, so tree rings provide a climate record that does not extend very far into Earth’s past. It is important to note that a tree does not have to be cut down to study tree rings. A small instrument called a borer is used to drill a core sample out of the tree.
Use a magnifying glass or a image viewing program to observe the cross section of tree trunk shown in the illustration on the right. Can you determine how many years this tree grew before being cut down? (Tip: you can click on the picture to open a larger version in a new window)
What we can learn from pollen and spores

In spring, pollen from nearby trees dusts the surfaces of many lakes. The pollen soaks up water and then sinks to become part of a layer of bottom sediments. Pollen grains from each species of plant have distinctive shapes, and their hard outer shells are readily preserved.
Scientists use a hollow drill to extract a core of bottom sediments deposited over thousands of years. In analyzing the sediment core, it is possible to distinguish annual layers by their appearance. Sediments contain particles of various sizes, ranging from tiny bits of clay to sand and large pebbles. These particles form annual layers, with thin layers of clay, formed during dry seasons, alternating with layers of sand and pebbles during rainy seasons.
The process of analyzing a core involves counting layers of sediment to determine when a particular layer formed, and then putting samples of the sediment under a microscope to identify pollen grains in that layer. By identifying the mix of plants that surrounded the lake, paleoclimatologists can infer what the climate must have been when that layer was deposited.
What beetles can tell us
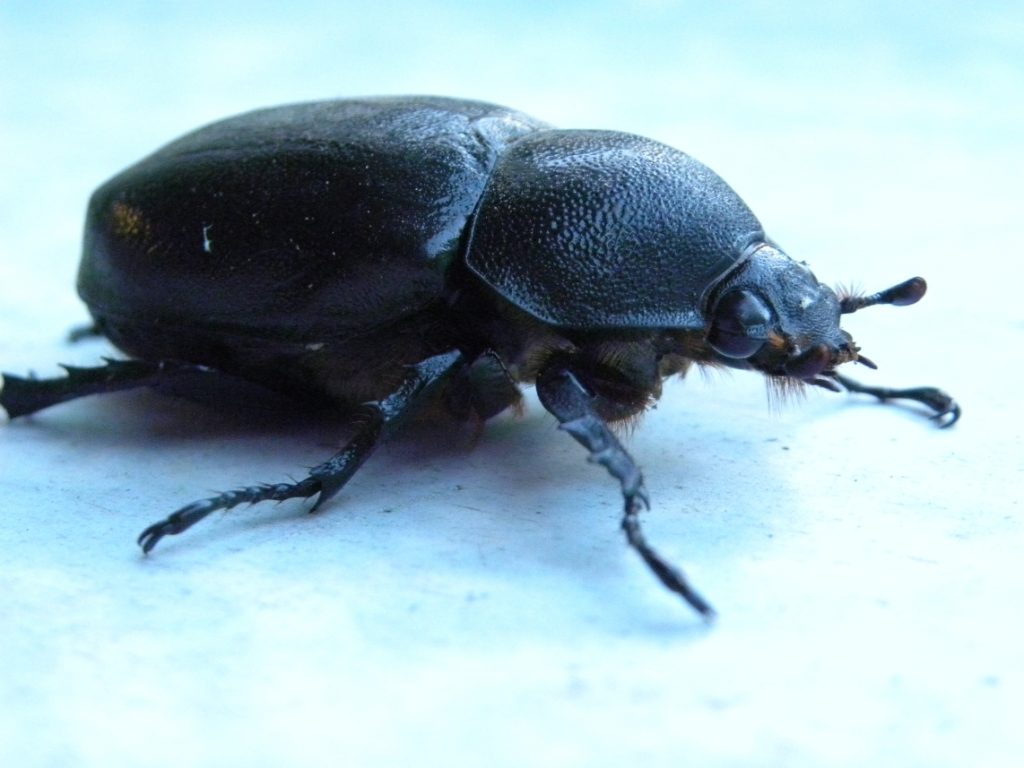
https://commons.wikimedia.org/wiki/File%3ARhinocerus_Beetle_Female_Australia.jpg
The scurrying behavior of beetles seems at first glance to be far removed from considerations of global importance, but study of the migrations of beetle populations can tell us much about ancient climates. Many species of beetles have existed without change for long periods of time. Since the hard body parts of beetles fossilize readily, their remains are found in great numbers in sedimentary deposits. It is possible to identify the species of beetles from these fossils and to compare them with species alive today. By identifying the species, we know the approximate range of temperatures that must have existed at that time. And, by using the various dating methods described in Chapter 3, we can determine when the beetles died. From such painstaking studies, scientists have been able to estimate the time and depth of ice ages over the past 50,000 years.
Loess and ice ages
Courtesy of US Geological Survey
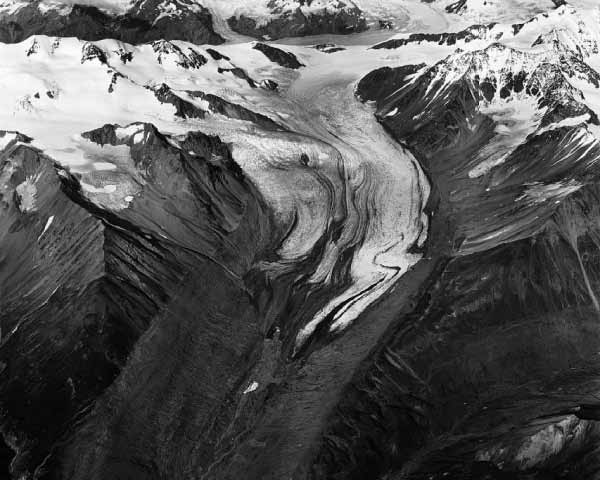
Glaciers are massive accumulations of ice that slowly move. Mountain glaciers are found in many parts of the world. A mountain glacier on a steep slope tends to slide slowly down the mountainside. Pushing trees and boulders in their path, glaciers also carry rocks along with them. These rocks scour and grind the surface of other rocks as the glacier slides down the mountain. The result is a fine powder of minerals and clay particles from the rock. Picked up by the wind and perhaps blown miles away, the rock powder, called loess, may enrich the soil where it finally settles. The fertility of America’s midwest, where wheat, corn, and other crops are grown, is due in part to the loess blown from the edges of glaciers during the last ice age. To a paleoclimatologist, loess in a layer of rock or in soil means that glaciers were present in that region when the rock layer was forming. Glaciers mean, of course, that the climate must have been cold enough to keep the ice and snow frozen year-round.
Drilling to the sea floor
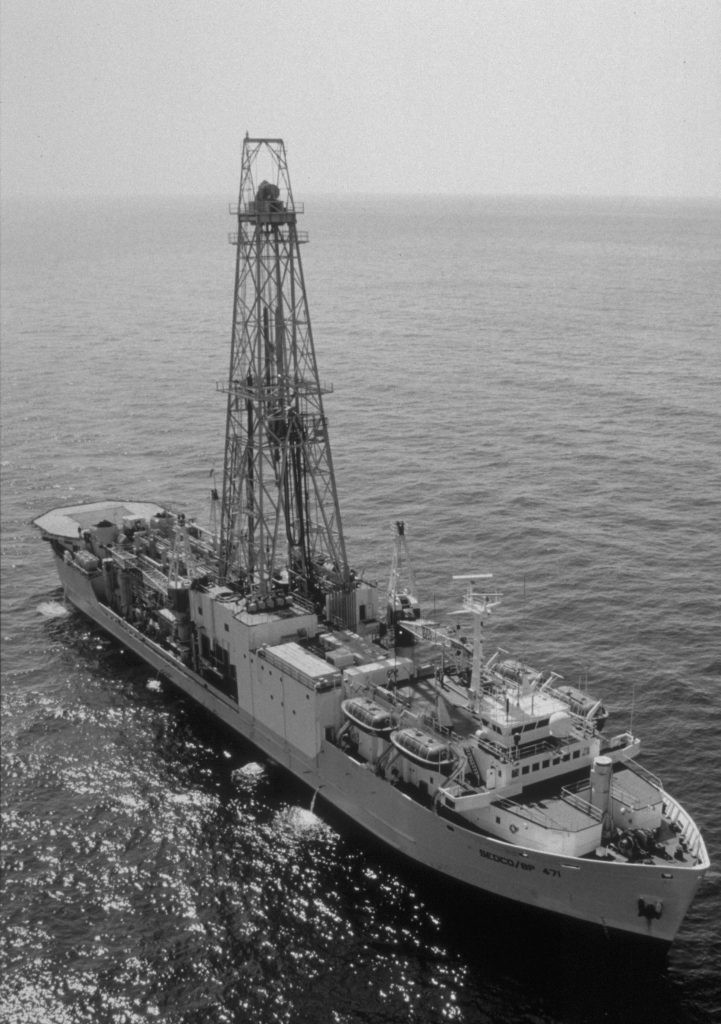
Near the edges of continents, particles of sand and soil from rivers flow into the ocean and gradually settle on the ocean bottom to form layers of sediment. The remains of sea life also settle on the ocean floor and become part of the layers of sediment. These layers therefore contain clues about the evolution of ocean organisms, changes in the global climate and sea level, and other information about Earth’s geologic history. To analyze clues in the sediment, scientists work on specially equipped ships that contain drilling machinery and research facilities. The scientists drill into the sea floor and extract cores of sediment for analysis. The JOIDES Resolution, pictured at right, is the flagship of the international Ocean Drilling Program. This ship has been used to obtain cores of sediment from the ocean floor at various locations around the world.
One clue to climate change is the presence of tiny fossil shells of microscopic organisms (foraminifera or forams for short) that accumulated in layers on the ocean floor. Using a microscope, it is possible to identify the species of forams in each sediment layer. Interestingly most of the ancient foram species are found in today’s oceans. By assuming that the temperature range of living forams is the same as their ancestors, we estimate the temperature ranges that must have existed in the ancient oceans.
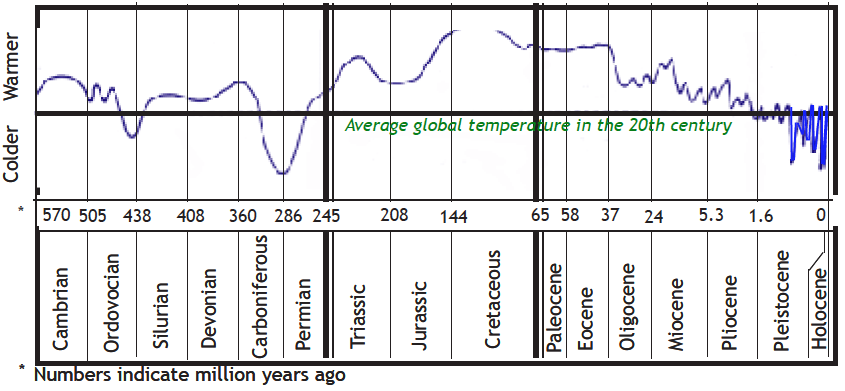
III. Climate History of the Past 570 Million Years
Using many of the above methods, paleoclimatologists can tell a fairly detailed story of climate changes since complex life started, about 570 million years ago. The graph on this page shows Earth’s average temperature since that time. It shows cold temperatures at the end of the Ordovician period (440 million to 430 million years ago), an even colder era at the end of the Carboniferous and well into the Permian (300 million to 260 million years ago); then considerable warming during the Cretaceous.
After the great extinction event some 65 million years ago, the temperature stayed nearly constant until about 35 million years ago, when it started to get cooler. Paleoclimatologists suspect that this cooling was due to the movement and collisions of continent-size land masses. At several places in the world continents were colliding and building huge plateaus and mountains. (Wind that encounters a mountain range or plateau is forced upward, where the air is under less pressure, so it expands and cools.) Also at about this time the continent of Antarctica drifted to its present location over the South Pole. With little sunlight to warm the land, glaciers formed. These vast sheets of ice reflected more sunlight into space, further cooling the whole planet.
This downward trend in temperature continued. When the freezing point of water was reached over large parts of the globe, the ice ages began. Although glacial temperatures prevailed over long periods of time, there were intermittent warmer periods, which are called interglacials. To investigate ice ages in detail, a new method of systematic study was needed. That method involved drilling deep into glaciers near the North and South Poles.
Chart of average global temperature
IV. The Ice-drilling Record in Antarctica
Physics Institute, University of Bern.
Courtesy of Oak Ridge National Laboratory.
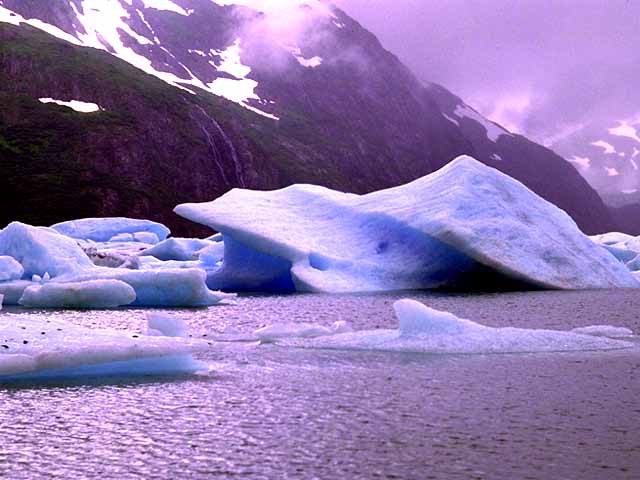
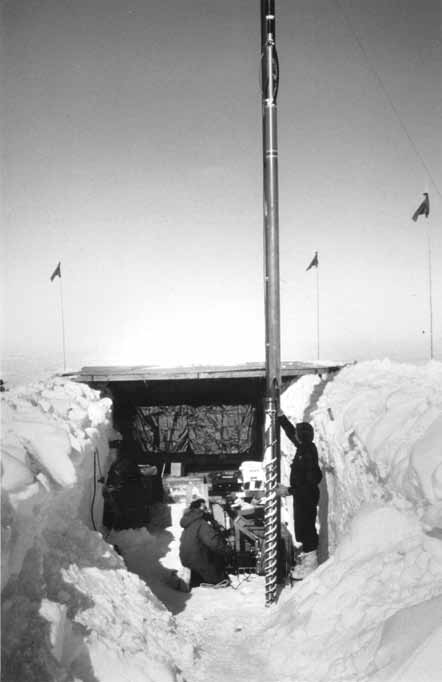
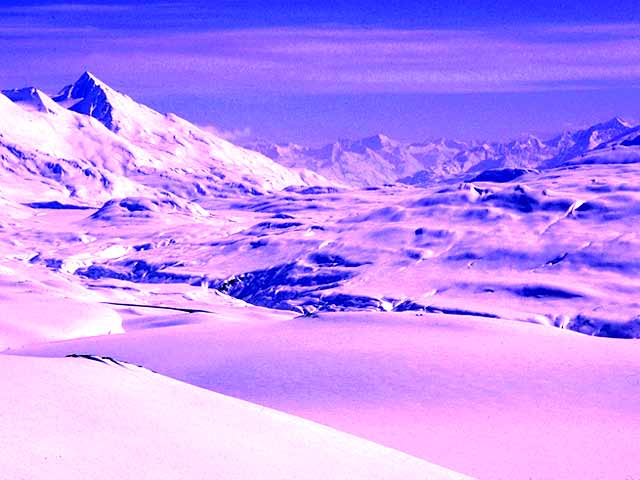
In Antarctica, Greenland, and Alaska, and on certain mountains, snow falls and does not melt. Layer upon layer, over long periods of time, the snow accumulates, compressing the layers below into solid ice. These stable accumulations of snow are called ice sheets.
The snow that falls this year lies fluffy and white on the surface of last winter’s snow. It is fluffy because of the air that is caught between the snow crystals. The new layer adds its weight to the layers of snow that fell the years before. Lower down, the snow of 25 winters ago begins to solidify. Fifty layers down the pockets of air within the snow begin to be trapped in bubbles as the snow is compressed into ice. In another 25 years the bubbles will close completely and the air will be preserved, sealed in solid ice.
From the deep Antarctic ice sheet, modern paleoclimatologists have extracted valuable information about the past 420,000 years. To do this, they drilled into the ice with a specially constructed hollow drill and removed a cylinder, or core, that revealed annual layers.
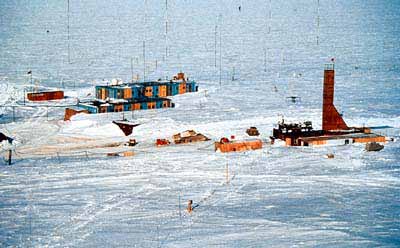
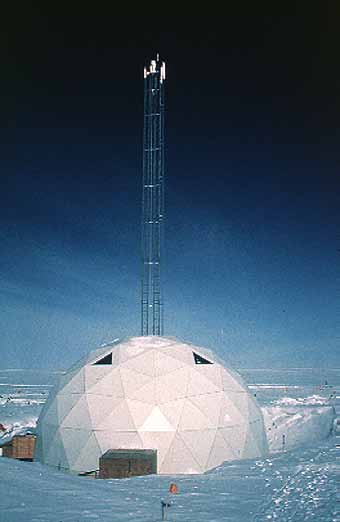
Extracting the ice core was not easy. At Vostok the average annual temperature is -55° C. The extreme cold made outside work exceedingly difficult. The hollow drills had to pierce the ice and preserve the core. Sometimes the drill bit clogged with ice or the pipe froze to the sides of the hole. Antifreeze liquids were used with care so they would not contaminate the ice core. Each segment had to be carefully brought to the surface without shattering.
After nearly 30 years of difficult drilling, in January 1998 a Russian team succeeded in reaching a depth of 3,623 meters. Ice at that depth is 420,000 years old.
The work at Vostok was an international effort. Throughout this long-term investigation technicians from France and Russia analyzed samples of the ice on the spot for chemical content. American planes flew portions of the ice core to laboratories in France for analysis.
In the French laboratory, scientists first determined the age of each layer. Beginning at the top of the core, the scientists counted layers into the past, just as we would count tree rings to see how many years have passed since the tree started to grow. The scientists were able to check the accuracy of their counting by looking for signs of well-known volcanic eruptions. Such eruptions caused clouds of dust that blanketed the world. The dust showed up as a dark layer in the ice.
Next, the scientists analyzed the ice in each layer to determine the temperature of the air when the layer formed. The method of chemical analysis used to measure temperature is described on page 106. The graph on page 99 shows what the scientists found out.
V. Results from Vostok
During the most recent ice age, which ended about 11,000 years ago, the northern ice cap reached well into what is now the United States, and as far south as northern California and New York. In some places the ice was several kilometers thick. So much ice formed at the poles that sea levels were as much as 140 meters lower than they are now.
Temperatures calculated from the Vostok ice cores in Antarctica:
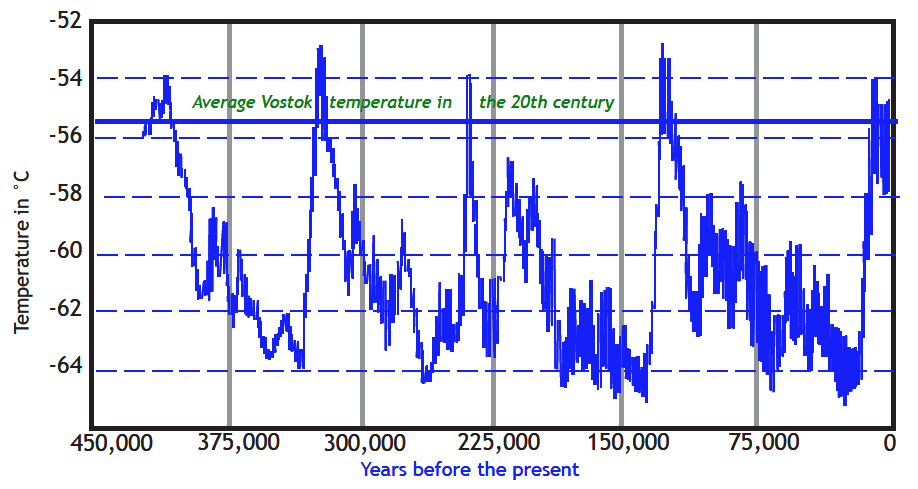
As the Vostok temperature graph shows, the temperature was not uniform during the last ice age. The graph shows four interglacial periods—the current interglacial period that humans have enjoyed since the last ice age ended, and three previous interglacial periods, each of which lasted for several thousand years.
There is no hard-and-fast rule about how cold it needs to get in order to declare that an ice age has begun. Looking at the graph, imagine what the conditions must have been like for our human ancestors and the plants and animals that were alive during an ice age. In your opinion:
Question 10.1.
What is the difference in the average temperature between an ice age and an interglacial period?
Question 10.2.
How does that difference compare with the temperature swing in a typical day where you live? Why would a difference of this amount in the average global temperature make such a huge difference in climate of our entire planet?
Question 10.3.
Some scientists have looked at this graph and concluded that we are headed for another ice age. If you agree, about when will the next ice age begin? If you disagree, what are your reasons?
Question 10.4.
Notice the overall structure of an ice age cycle. Warming takes place more rapidly than cooling. Looking carefully at the graph, estimate approximately how long it takes from the time cooling begins to when the average temperature drops 6°C. About how long does it take for temperatures to rise 6°C?
V. What Caused the Recent Ice Ages
The Serbian mathematician, Malutin Milankovitch, suggested a theory to explain ice ages in the 1920s and again, with more data to support it, in the 1930s. However, it was many years later and with many further studies before climatologists accepted his theory.
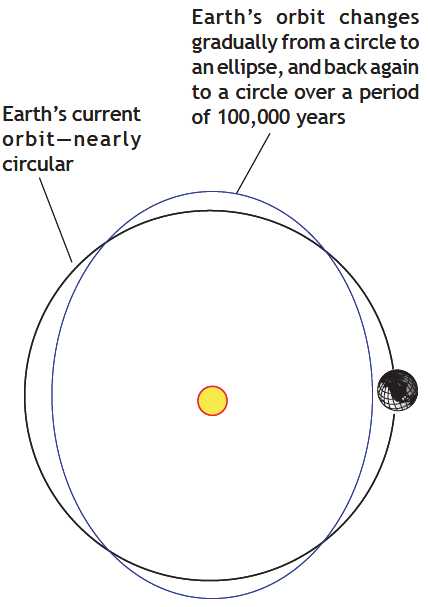
Milankovitch proposed that the cycle of ice ages were a result of changes in the relationship between Earth and the Sun. One of these changes is in the shape of Earth’s orbit around the Sun. Over a period of 100,000 years the orbit gradually changes from a nearly perfect circle to an ellipse, and back again to a circle. When Earth’s orbit is nearly circular, the distance between Earth and Sun remains the same during the entire year. However, when the orbit is more elliptical, the distance between Earth and the Sun varies during the year. Although the difference is less than 0.3% (three-tenths of one percent), it can be enough to cause winters to be colder than normal. This cooling can be amplified by factors such as an expanding polar ice cap reflecting more sunlight into space, which could push the climate system into an ice age. An interglacial period would occur when the orbit becomes more circular, as it is now.
Another factor Milankovitch measured was the gradually changing tilt of Earth’s axis.
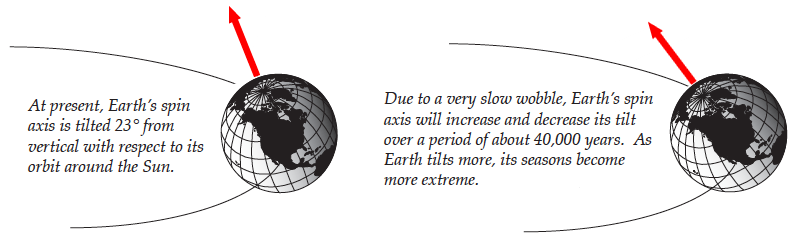
To understand this idea, think of Earth as a spinning top. As a top slows down it starts to wobble. Earth’s spin axis wobbles very slowly, tilting more or less over a period of about 40,000 years. (Today, Earth’s axis is tilted at 23.5°.) When the axis is tilted further (up to 24.5°), winters would get colder and ice sheets would extend into regions that are now temperate. The ice would reflect the sunlight and make the temperature even colder. When the axis is less tilted (as little as 22°), the seasons would be less extreme. Polar ice caps would shrink and reflect less sunlight, allowing the Earth to warm.
When the average climate was warmer, as it was during the Cretaceous, the variations in Earth’s orbit were not noticeable. But when shifting continents caused mountains to build up and Antarctica moved over the South Pole, the whole planet cooled enough so that variations in Earth’s tilt made a bigger difference, and the most recent ice ages started.
If the changes in Earth’s orbit and axis were the only important factors, the temperature would not have changed as much as it did between ice ages and interglacial periods. Another factor has amplified the oscillation between warm and cold—the composition of the atmosphere.
VI. Greenhouse Gases and Ice Ages
In addition to analyzing the ice in each layer of a core to determine the temperature when the ice formed, scientists also determined the composition of the air trapped in each layer. To do this they cut the sample into one centimeter cubes. One cube was placed in an airtight container and the surrounding air was pumped out. The gas in the bubbles would escape as the cube was crushed. Using sensitive gas analysis equipment, the scientists measured the proportion of carbon dioxide and other gases that were present in the atmosphere when that ice layer formed. The results of this analysis are shown on the next page, along with the temperature graph shown earlier in this chapter.
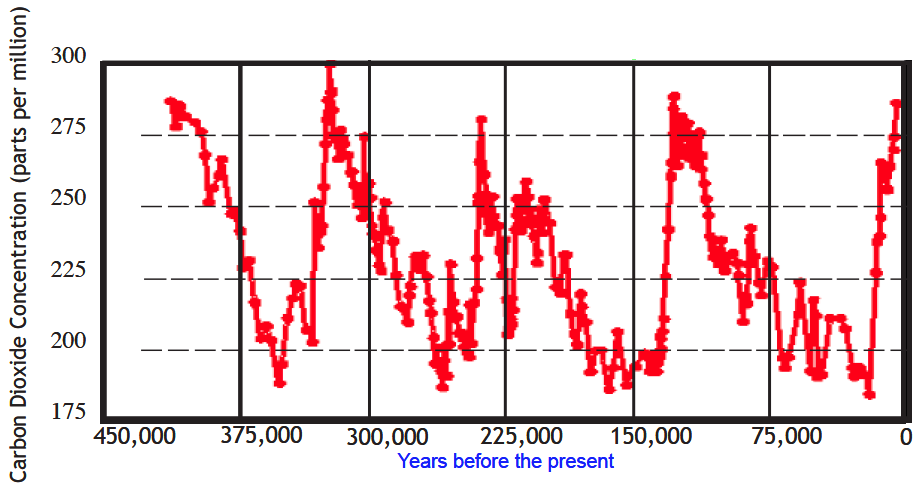
The graphs show the average temperature and concentration of carbon dioxide for the past 420,000 years. Both sets of data were derived from the same ice core. Notice that the concentration of carbon dioxide at “0” years is about 280 parts per million. That was the concentration of CO2 about 150 years ago, before the industrial revolution. The composition today is more than 360 parts per million. The time scale of the graph is too long to show this very recent increase in CO2 concentration.
Compare the two graphs. How are they similar? How are they different? In your opinion, what do the similarities and differences imply about the relationship between carbon dioxide in the atmosphere and the average global temperature?
The theory of global warming mentioned earlier in this unit suggests that climate warms as carbon dioxide increases. However, the scientists who analyzed the ice core found that in many cases the warming often preceded the increase in carbon dioxide concentration by a few thousand years. These scientists suggested the following explanation:
- Changes in Earth’s orbit and spin axis according to Milankovitch’s theory triggered an interglacial period.
- As the oceans warmed, circulation patterns changed and the ocean water gave up some of the dissolved carbon dioxide. These gases bubbled to the surface and enriched the air.
- Increased carbon dioxide warmed the air further due to the greenhouse effect. This is called a “positive feedback effect.”
- As the air warmed, glaciers and ice caps melted. Less sunlight was reflected into space and Earth warmed even further. This is another positive feedback effect.
Eventually, changes in the Earth’s orbit and spin axis reversed the heating process described above. Ice sheets formed, reflecting more sunlight into space; oceans dissolved more carbon dioxide so the greenhouse effect was reduced; and Earth entered another ice age.
The first graph below shows the average temperature in the Antarctic region for the past 420,000 years based on analysis of an ice core from Vostok Station. The second graph below shows the average concentration of carbon dioxide in the atmosphere for the same period, derived from analysis of bubbles of air trapped in the same ice core.
VII. Ice Cores in Greenland
The Vostok records revealed a detailed picture of climate history over the past 420,000 years. Yet it also raised an important question: did the conditions in Antarctica represent what occurred over the entire planet, or only in the Antarctic region?
To answer this question other major international research programs were undertaken at the other side of the world—in Greenland. The annual accumulation of snow in Greenland is higher than in Antarctica, so the layers of ice are thicker. That meant it was possible not only to confirm the Vostok findings but also to make more detailed analyses. In brief, the results of these projects were as follows:
• The ice age/interglacial cycle was a worldwide phenomenon. The increase and decrease in temperatures took place at about the same time in the Northern and Southern Hemispheres.
• Major climate changes could occur amazingly quickly, on the order of only a few years. This finding supported the theory that shifts in ocean currents may play an important role in large-scale climate changes.
• As in the Southern Hemisphere, greenhouse gases played an important role in the shift from icy conditions to a warm interglacial period like the one we enjoy today.
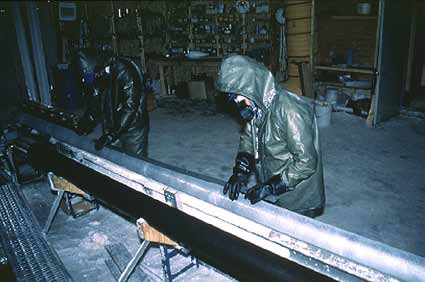
Photo by Kendrick Taylor, Desert Research Institute, University and Community College system of Nevada.
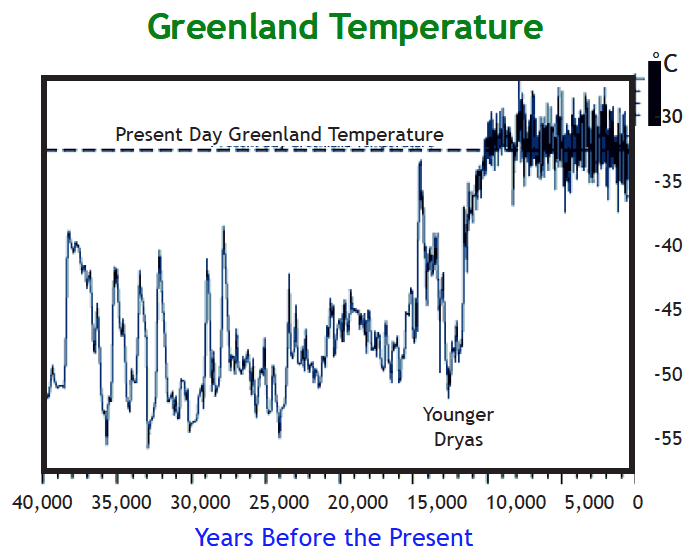
Graph from “Secrets of the Ice” website. http://www.secretsoftheice.org/icecore/studies.html. Museum of Science, Boston. Data for this graph are provided by the University of Washington, from the Greenland Ice Sheet Project 2 (GISP2). More information about this project is available at http://www.gisp2.sr.unh/edu/GISP2
This graph shows the average temperature in the Greenland region from about 40,000 years ago to the present. It shows that during the last ice age the climate was quite variable. Near the end of the ice age—about 14,500 years ago—the climate began to warm, and then it grew cold again, before the temperature stabilized about 10,000 years ago.
The final cold period, which lasted nearly 2,000 years, is called the “Younger Dryas,” and is named for an arctic flower whose pollen can be found in some ice core layers. No one knows for certain why it grew cold during the Younger Dryas. However, one theory is that when Earth began to warm, about 14,500 years ago, the huge glacier over the North Pole began to melt. The resulting flood of fresh water changed ocean currents, preventing them from spreading warmer temperatures to northern climates.
The Younger Dryas ended and the climate reached interglacial temperatures as summer sunshine in the Northern Hemisphere reached a maximum, about 11,000 years ago. Greenhouse gases again came into play, since warmer waters hold less dissolved carbon dioxide. Carbon dioxide would have bubbled from the ocean, increased its concentration in the atmosphere, and warmed the planet further. Finally, the average global temperature reached a stable level during the recent (or Holocene) period which we are in now.
Compared with the earlier ice ages, climate changes during the Holocene have been small, averaging no more than about 0.5°C. However, as we’ll describe in Chapter 11, even these “small” changes made a huge difference for people who lived at that time, since their lives were dependent primarily on farming.
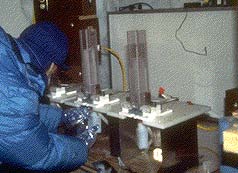
Photo courtesy of Mark Twickler,
University of New Hampshire
What Are the Chemical Clues To Temperature?
The analysis of a sample of ice from an ice core, such as the one pictured above, is based on different forms of oxygen atoms—oxygen-16, oxygen-17, and oxygen-18. All oxygen atoms have 8 protons in the nucleus. Most oxygen atoms also have 8 neutrons. This kind of oxygen atom is called oxygen-16. In nature, 99.76% of all oxygen atoms are oxygen-16. In some oxygen atoms there are 8 protons and 9 neutrons. This is called oxygen-17 (8 protons plus 9 neutrons = 17 particles in the nucleus). In nature, 0.04% (four out of 10,000) of all oxygen atoms are oxygen-17.
As you may have guessed, oxygen-18 contains 8 protons and 10 neutrons. In nature, 0.2% (two out of 1,000) atoms are oxygen-18. Oxygen -16,-17, and -18 are called isotopes of oxygen. One atom of oxygen-18 is slightly heavier than one atom of oxygen-17, which is slightly heavier than oxygen-16.
Imagine what happens at the surface of the ocean during a warm period. When energy (from the Sun or another source) is added, water molecules speed up and escape into the air. We call this evaporation. While both heavy and light molecules are more likely to escape when the temperature increases, the ratio changes. More of the heavier molecules evaporate in warm weather than in cooler weather. So water vapor that is in the air during warm years will be enriched in oxygen-18.
Now consider what happens to the water vapor in the air during a warm period. Some of it collects in clouds and forms precipitation (rain or snow). When precipitation falls over very cold regions, it is incorporated into glaciers. Scientists who analyze that layer of ice recognize that the additional oxygen-18 means that the surface of the sea must have been warmer that year.
What happens to the water that remains in the ocean? It has a lower proportion of oxygen-18, and organisms in the water will absorb a lower proportion of oxygen-18. Scientists who analyze the fossil forams in a layer of sediment from the sea floor recognize that the lower proportion of oxygen-18 means that the surface of the sea must have been warmer that year.
VIII. Conclusion
Many different pieces of evidence provide information about the Earth’s past climate—tree rings, fossil beatles, pollen, loess, ice cores, and ocean floor sediments. The data from many different sources and locations around the planet show that gradual cooling started about 33 million years ago, and the Earth’s atmosphere is still cooling. Three million years ago it became cold enough for water to freeze over much of the planet—without melting in the summer—for periods of approximately 100,000 years. Each ice age was followed by a brief interglacial period.
Understanding how Earth’s climate varied in the past provides a key to understanding how natural forces and human activities are likely to change Earth’s climate in the future. This is a reason why climate researchers continue to brave the frigid temperatures in Greenland and the Antarctic, and to struggle with the elements to maintain the integrity of their data.
We’ll return in the last chapter to questions about how human activities may be changing the climate. First, we’ll look at how the recent ice ages have affected the evolution of a species that is of special interest to us—Homo sapiens.