
AC8.1. Exoplanet Transits
Investigation 8.1
{ A Changing Cosmos Contents }
Who would have guessed that from simply measuring brightness changes in a star, we could find not only whether the star has a planet, but a host of interesting properties of that planet as well. Even whether or not the planet might be inhabitable by life forms!
Using image processing software and telescopic images of stars, we can make measurements of star brightness, then plot a light curve (graph of brightness vs time) for a planet transit and analyze it to find out those interesting properties hadn’t dreamed of knowing before before 1995.
This Investigation has five parts:
- Plot a Transit Light Curve
- Examine the Light Curve
- Find the Planet’s Size
- Find the Distance of the Planet from its Star
- Is the Planet Habitable?
Materials
- One of the image processing (IP) apps listed for A Changing Cosmos on the GSS software page.
- Images — use jpeg images from the “8exoplanetTransit” folder of the jpg image set for A Changing Cosmos or
FITS images from four possible sets:- 20 images of HD189733 (included in SalsaJ 2.3 software as of 2016, from EUHOU Exercise “Discover an Exoplanet: The Transit Method“)
- 34 images of TrES-3 (jpg)
- 19 images of star SAO 107623 (also called HD 209458)
- 102 images of GJ436 (jpgs) from Bareket Observatory (Israel)
These are observations of four different stars (HD189733, TrES-3, HD209458, GJ436) each containing a transit event—the dimming of the star as a planet passes in front of it.
First let’s have another look at graph E of the light curves near the end of chapter 6.
8.2. What would determine how much dimming occurs during a transit of a planet in front of a star?
8.3. What would affect how long the transit lasts?
8.4. What would determine how often a transit occurs?
8.5. What properties of a planet could we tell from observations of transits?
Plot -||- Examine -||- Size? -||- Distance? -||- Habitable? -||- Page Contents
I. Plot a Transit Light Curve
In order for a planet transit (and corresponding dimming of the star’s light) to be observed:
- The planet’s orbital plane must be in line with our view of the star (as with eclipsing binary stars). Geometrically, less than 2% of exoplanets would satisfy this condition. (See illustration of Geometry for Transit Probability on the NASA Kepler About Transits page.)
- The planet must be large enough for us to detect a drop in brightness. Earth based observations can detect a drop of 1% from a transit of a Jupiter sized planet.
Each image is really 20 or so images “stacked” on one another so that “noise” in the resulting image is kept to a minimum.
Comments about each image set:
- HD189733 (20 images) – The exoplanet orbiting the star HD 189733 was discovered on October 5, 2005 by transit method in France. It was the very first star for which planet transits were observed. The planet had already been discovered by the spectroscopic method.
The planet is known as HD189733b. Planets around a star are designated by a lower case letter of the alphabet, with the star taking the letter “a” and each orbiting body taking a letter in the order of their discovery. HD189733b was the first planet discovered around star HD189733.
The images in this set were taken with the NASA Spitzer satellite. We list this set first because a macro is automatically included with SalsaJ software that can Open all 20 images and tile them. (Images are also available by downloading this file: 20 image_spitzer 4.77 Mb . - TrES-3 – The TrES-3 images were provided by Todd Klaus who worked in the Kepler Science Operations Center as Lead Software Engineer at NASA Ames Research Center in Mountain View CA. The telescope used was at the Zen Observatory.
- HD209458 (19 images) – As is common HD209458 has multiple names for the same star, another being SAO 107623. This is part of the Astronomical Image Set for A Changing Cosmos, the Hands-On Universe high school course, part of Global Systems Science. John Kolena, HOU TRA, has found that good reference stars are at: x = 185, y = 181 or x = 311, y = 276. (The originally suggested reference star was the one at x = 564, y = 266.)
- GJ436 – The 102 GJ436 images were provided by Bareket Observatory. This set, being so large, lends itself to teams of students dividing the task into smaller batches of images and pooling the results.
For any given set of images, use the following procedure (like the Finding Supernova investigation—Chapter 6).
- Find the time of each image from the Image Header Info. Find the difference, in minutes, between the observation time and the time of the first image (i.e. 10/20/2001, 3:06 UT for HD209458).
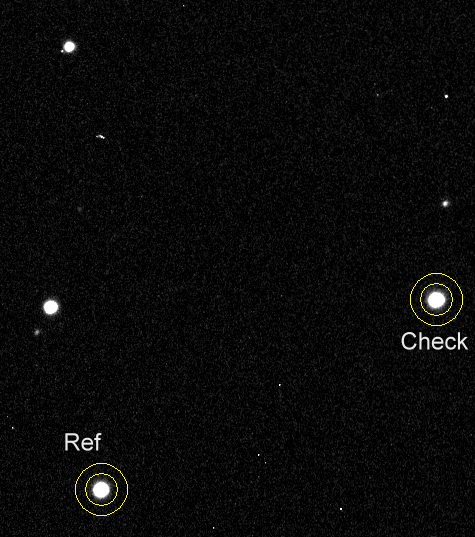
- Identify the correct star on the image. Use your judgment or a finder map. For all the image sets except for one (HD 209458), there is a special labelled star finder image with reference stars marked. For HD 209458 (SAO 107623), it’s the star that is the brightest. Take some Counts measurements using the Aperture tool to make sure you’ve found the brightest star.
- Find reference star(s). The bright star about 45° to the upper right of HD 209458 (x = 564, y = 266) can be a reference star. Even better reference stars are at (x = 185, y = 181) or (x = 311, y = 276).
8.6. Using Aperture, measure and record the Counts of the star as well as the reference star. Then divide the Counts for the star by the Counts for the reference star to get the Count Ratio for each image. Make a light curve for the star by plotting the Count Ratio versus time (in min). Before graphing, look at the range of Count Ratios and optimize the range of y-axis values (maximum value just above the highest Count Ratio and the minimum value just below the lowest Count Ratio on the axis).
Plot -||- Examine -||- Size? -||- Distance? -||- Habitable? -||- Page Contents
II. Examine the Light Curve
DURATION
8.7. If you do not have data for a full transit, is there any way you could still determine the transit duration?
8.8. What was the duration of the transit you plotted in Part I?
8.9. Would the duration be the same for all transits of a given star-planet combination?
TRANSIT DEPTH
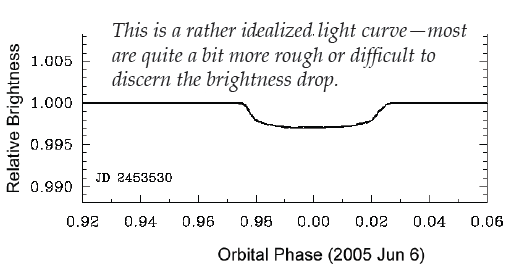
Transit Depth is the dip in the light curve. This is the drop in brightness of the star as a planet passes in front of it.
8.10. What is the Transit Depth (TD)—the maximum dip in brightness— of the transit you plotted in Part I, expressed as the ratio between the brightness before the transit and the brightness at the deepest point in the curve?
TD = fraction decrease in brightness of the star due to the transit
= (B1- B2)/B1 or (C1- C2)/C1 [B = brightness; C = Counts]
8.11. What makes it difficult to find the Transit Depth for this planet?
Plot -||- Examine -||- Size? -||- Distance? -||- Habitable? -||- Page Contents
III. Find the Planet’s Size
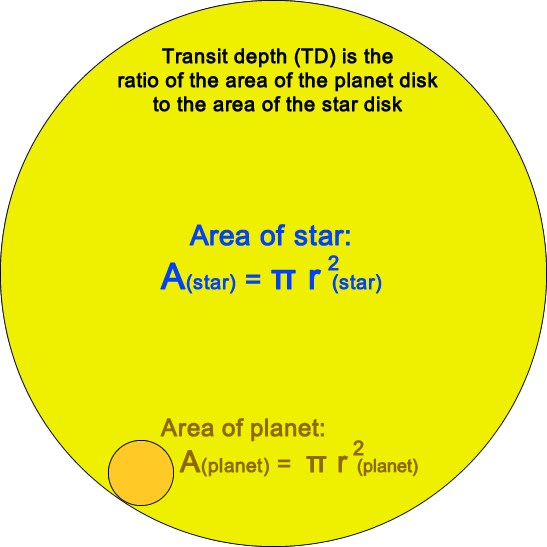
The transit depth (TD) is related to the size of the planet in a very simple way: the area of light blocked when the planet transits is exactly the area of the apparent disk of the planet. So, the ratio of area of planet disk to star disk should directly determine the drop in brightness.
TD = (area planet)/(area star)
Since area = πr 2 ,
TD = (πrplanet2)/(πrstar2 )
TD = (rplanet /rstar )2
8.12. What is the radius of planet? [First find the radius of the star (from Internet or clues from teacher or colleagues), and then use the transit depth equations in both II and III to find the radius of the planet]
Size Matters
The size of the planet gives us crucial information about its possible habitability. It’s a little like the Goldilocks story.
If the planet is too small (like Mercury or Mars), it will not have enough gravity to hold on to an atmosphere—gas molecules will escape the planet over a time-span of not many years in the lifetime of the planet-star system.
If the planet is too large, it will retain a huge amount of atmosphere and have crushing atmospheric pressure, like the giant planets Jupiter and Saturn.
PERIOD
8.13. What does Kepler’s Third Law tell us about how the period of a planet is related to its distance from a star?
One light curve cannot show the period of the planet. The star must be observed for many days, weeks or months in order to establish that the transits occur in a regular period.
8.14. What is the period of the planet? (Use library or Internet search, e.g. the NASA Exoplanet Archiveor exoplanet catalog.)
Plot -||- Examine -||- Size? -||- Distance? -||- Habitable? -||- Page Contents
IV. Find the Distance of the Planet from its Star
8.15
Using Kepler’s Third Law, what is the orbit radius of the planet in Astronomical Units (AU)?
Distance Matters
The distance of the planet from its star gives us crucial information about its possible habitability. Again, it’s like the Goldilocks story, but an even closer analogy, since the “soup” will be either too hot or too cold for life. More precisely, the temperature must be in the range to allow for liquid water, which is an essential ingredient for nearly all life forms that we know of. If the planet is too close to its star, all water vaporizes, and if the planet is too far from its star, water is all frozen.
Plot -||- Examine -||- Size? -||- Distance? -||- Habitable? -||- Page Contents
V. Conclusion
Is the Planet Habitable?
8.16. What factors besides distance from star might impact the temperature of a planet?
8.17 Is the planet habitable? Justify your answer with results from parts I through IV of this investigation. Check your results against an exoplanet catalog.
More advanced exoplanet investigation
- Visit the NASA Exoplanet Archive at https://exoplanetarchive.ipac.caltech.edu.Hover your mouse over the Data tab and select KOI Table (Cumulative list).
- That will display all the Kepler mission KOIs (Kepler Objects of Interest). [https://exoplanetarchive.ipac.caltech.edu/cgi-bin/TblView/nph-tblView?app=ExoTbls&config=PS]
- For the confirmed planets, the third column lists the Kepler name, e.g. Kepler-227 b.
- A lot of information is in the table and it can be filtered by putting a number with an inequality symbol in a box near the top of any particular column. For example, if you put >300 in the Orbital Period column, only KOIs with periods greater than 300 will be displayed.
- If you click on the Planet Name (column one), a new window will display a lot more information about that planet. One the right side of that window, if you click on “Kepler TCE Time Series” a new window will open and the planet’s light curve will be plotted.
- Visit the TransitSearch website – http://www.transitsearch.org – to find and download data on exoplanets with observed transits. Find the time between consecutive transit observations to find period. Find the transit depth. If possible, get information about the parent star to determine the size of the planet and its orbit radius.
- Visit the Sloan Digital Sky Survey (SDSS) web page on Calculating the radius of a star – http://cas.sdss.org/dr6/en/proj/advanced/hr/radius1.asp. See the meaning and derivation of a formula that can be used to compute a star’s radius in relation to our Sun’s radius:
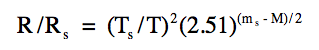
Where
R = star radius
Rs = Sun’s radius
T = Temperature of the star
Ts = Temperature of the Sun
M = absolute magnitude of the star
ms = absolute magnitude of the Sun = 4.83
Relationship of b-v magnitude and temperature is in chart below.
| b-v magnitude | Surface temperature (Kelvin*) |
| – 0.31 | 34,000 |
| – 0.24 | 23,000 |
| – 0.20 | 18,500 |
| – 0.12 | 13,000 |
| 0.00 | 9,500 |
| 0.15 | 8,500 |
| 0.29 | 7,300 |
| 0.42 | 6,600 |
| 0.58 | 5,900 |
| 0.69 | 5,600 |
| 0.85 | 5,100 |
| 1.16 | 4,200 |
| 1.42 | 3,700 |
| 1.61 | 3,000 |
Absolute magnitude is
M = m – 5 log d + 5
Where d = distance to the star in parsecs.
Use the Hipparchos skyplot to find parallax, distance to star, and compute absolute magnitude – http://www.rssd.esa.int/?project=HIPPARCOS&page=Sky_plot
Finally, visit the AAVSO website (http://www.aavso.org) and look for any exoplanet “campaigns” that are there (e.g on http://www.aavso.org/news/campaigns.shtml)
Also, try getting names of stars known to have transiting exoplanets from http://exoplanet.eu/catalog-transit.php (52 as of July 2008) and then do a search on the AAVSO website for any light curves they have for any of those stars.
To find out about the NASA mission to find Earth-size exoplanets, see http://www.planetarium-activities.org/nasa-kepler-mission.