
EF7. What Causes Thunderstorms & Tornadoes?
Chapter 7
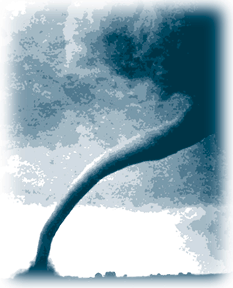
“Dad was outside and Mom and I were getting dinner ready,” said Karen Knobloch, who lived with her parents on a farm in northwest Iowa.
“Dad came inside and said we’d better get to the basement. It hit when we were halfway down the steps.” Windows were blown out, and doors were pulled from their hinges and splintered. The turkey, ham and relish on the kitchen table were covered with broken glass. Four silos had their tops blown away. Karen said, “It sounded terrible. But it was over in about four minutes. When we came out everything was a big mess. It looked like the main part of it missed the house.” (Tornado: Accounts of Tornadoes in Iowa, Second Edition, 1987; this story attributed to the Des Moines Register, April 28, 1986.)
The tornado described by Karen occurred about three weeks before the eruption of Mount St. Helens in Washington State. Two tornadoes damaged fourteen farms that day, killing a four-year-old girl and injuring two of her relatives. In July of the same year a tornado hit a coal-burning power plant in Sioux City, Iowa, causing $50 million in damage. The previous year a tornado cut a 33-mile swath of destruction through Iowa, destroying 30 farmsteads; and the year before that forty tornadoes struck four states in a single day, devastating the town of Barneveld, Wisconsin, killing 36 of its residents, and injuring 200.
Eruptions like Mount St. Helens might occur a few times in a century. An average of two tornadoes—like the one described by Karen Knobloch—occur each day in Iowa during tornado season. Tornado season starts in April and ends in June, when atmospheric conditions are ripe for thunderstorm conditions that breed tornadoes. Several hundred tornadoes occur annually in the U.S. Although most occur in the Mid-West during tornado season, tornadoes can occur at any time; and twisters have been recorded as far east as Boston, and as far west as California.
Wherever we live, we need to be conscious of the energy flow around us—both the destructive energies of tornadoes and hurricanes, and the nurturing forces of wind, rain, and sunshine. We may complain about the weather, but without it we wouldn’t survive. Like so many other unpredictable aspects of life on the third planet from the Sun, we need to learn to live with it.
Tornadoes are born in thunderstorms. Thunderstorms are part of Earth’s energy balance. In the previous chapter we saw that the Earth must radiate all of the energy it receives back to space, or it will get hotter and hotter. Most of the Earth’s heat is radiated back into space from the surface, in the form of infrared energy. But a third of that energy is carried to the upper atmosphere by thunderstorms. Without thunderstorms, our planet’s average climate would be about 12°C hotter than it is now.
In this chapter we’ll see how the distribution of the Sun’s energy around the entire planet results in thunderstorms and tornadoes. We’ll start with the two most important factors—the uneven heating of the Earth and seasons.
I. The Earth is Heated Unevenly
Remember Franck Petersson from Tromso, Norway? He lives north of the Arctic Circle. That means he lives within 23½° of the North Pole. Frank never sees the Sun in winter. He feels its warmth only during the late Spring, Summer, and early Fall. In Summer the Sun is up all day long.
Max Rojas is an artist who lives in Costa Rica, a few degrees north of the Equator. From Max’s point of view, days and nights are always about the same length, and the Sun always climbs high in the sky at midday, so the climate is warm all year.
You probably live somewhere between the equatorial and polar zones. The entire United States is within the temperate zone, between the Arctic Circle (23½° from the North Pole) and the Tropic of Cancer (23½° from the equator). Whether or not you have snow in the winter, you probably experience seasons of some sort. During the summer, when the Sun climbs higher in the sky, it is warmer in most areas. During winter, when the Sun is lower in the sky, it is colder.

EF7.1. Investigation:
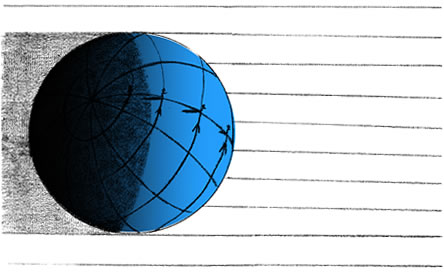
Pencil Model of Sunlight Beams
To see why the height of the Sun in the sky makes a difference in how warm it is, take three sharpened pencils, and lay them on the picture above, pointing towards the Earth. The pencils represent three beams of solar energy. When they strike the Earth near the equator they concentrate the energy on a small area of ground. When they strike the Earth near the poles, they hit at an angle, so the energy is spread out over a large area. Try it! Compare how the Sun warms all of the various regions of the Earth, including the region where you live.
You can also simply hold 3 pencils together and have them make simultaneous marks on a flat piece of paper, first with the pencils perpendicular to the paper and then with the pencils at an extreme angle to see how angle affects the model “intensity of Sun’s ray.”
II. The Reasons for the Season
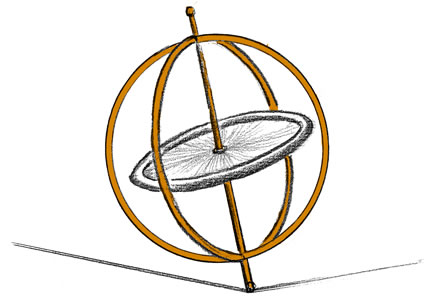
A gyroscope is a sort of top that has a heavy disk of metal that can spin. There are toy gyroscopes that you spin by wrapping a string around the central bar and pulling on it. Once a gyroscope starts spinning, it is very difficult to tip it over. You can hold it on a fingertip, or even make it “walk a tightrope” on a piece of string. It will continue to keep its spin axis in the same direction, no matter what.
The entire Earth is like a huge gyroscope that spins once in twenty-four hours. It also revolves in its orbit around the Sun once in 365 days. The orbit of the Earth lies in a plane, like a table top, with the Sun in the middle. If the Earth’s spin axis were vertical with regard to this plane, Earth would not have any seasons at all. It would be hotter near the equator and colder near the poles, because the Earth is spherical in shape; but the climate in each zone of the Earth would always remain the same. But the Earth’s spin axis is not vertical. It is tilted 231¦2 degrees from vertical—a very heavy, stable gyroscope that keeps its tilt as it moves slowly in its orbit around the Sun.
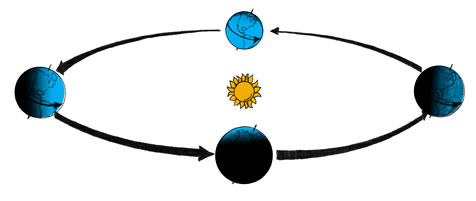
The spin axis of Earth always stays pointing the same direction in space: almost exactly towards the North Star. Caution: this view of the Sun-Earth system is very distorted. For one thing, the shape of Earth’s orbit is really very nearly circular. The view depicted here is as if we are viewing it nearly edge on.
Because of the tilt of the Earth’s spin axis, the Northern Hemisphere is tilted towards the Sun during June, July, and August. That makes the Sun appear higher in the sky, and creates:
- more hours of daylight.
- more concentrated sunlight per area of ground.
The net result is Northern hemisphere of Earth warms up, bringing summer. During the same months, the Southern Hemisphere is tilted away from the Sun, so it appears low in the sky. When it’s summer in the Northern Hemisphere, it is winter in the Southern Hemisphere.
Many people mistakenly believe that the Earth is closer to the Sun in summer. In fact, the Earth’s orbit is very nearly circular, although our planet is slightly closer to the Sun in January, making the Northern Hemisphere winter slightly warmer than it would be otherwise. The cause of the seasons is the tilt of the Earth’s spin axis—not its changing distance from the Sun.
III. Global Wind Patterns
Put a pot of water on to boil and notice where the convection currents start—over the hottest parts of the burner. Likewise, huge convection currents in the Earth’s atmosphere start in the equatorial zone, where the Sun’s rays are most concentrated.
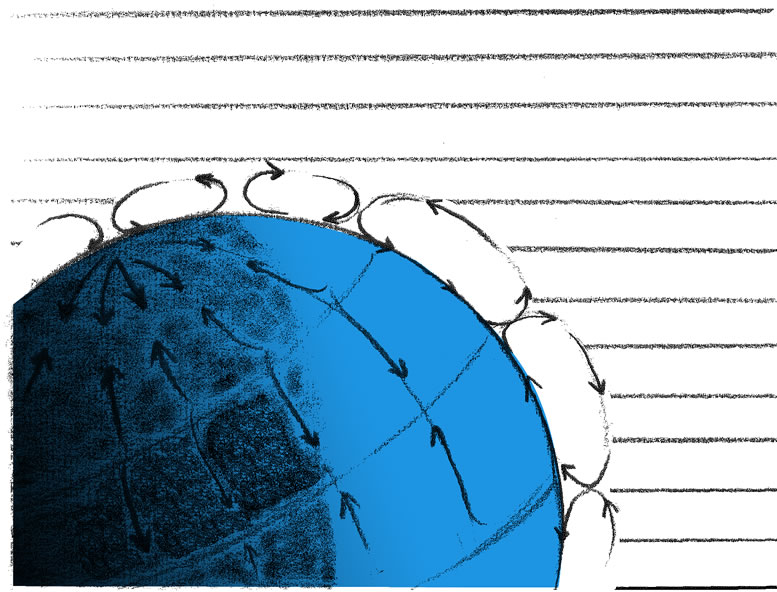
Wherever sunlight is most concentrated a huge mass of air is heated, and the molecules start to move faster, pushing each other further and further apart. The air mass expands, becomes less dense, and begins to float. When the expanding air mass reaches the bottom of the stratosphere (about 16 kilometers up), it starts to cool and spread out. Some of the air moves south and some moves north.
About a third of the way from the equator to the poles, the air has cooled enough to start to contract and become denser. It begins to fall to the surface and move towards the Tropic of Cancer to replace air that is just now floating upwards. As the air moves across the surface of the Earth we feel it as wind.
Further north, in the temperate zone, another convection current forms. And near the North Pole yet another huge current forms. Look at the drawing and notice the pattern of winds on the Earth’s surface. Cold winds blow from the North Pole toward the temperate zone to meet moderately warm winds moving poleward; while in the equatorial zone, even warmer winds move south to replace air that has floated up into the stratosphere.
Around the world, winds are the bottom portions of giant convection currents. A wind moving northward means that several kilometers up in the sky there must be another stream of air moving southward.
IV. Effect of the Earth’s Spin
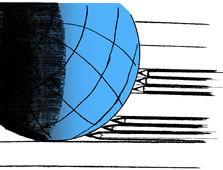
If the Earth did not spin, wind patterns would move due north and south. But the Earth does spin, and that affects global wind patterns. To see how, imagine a bird taking off from the North Pole to fly to an island somewhere south of the Arctic Circle. After six hours the bird arrives, only to discover that the island is gone! Where could it have gone?
If you haven’t already guessed it, the Earth made one quarter turn in that six hours, and the island is now several thousand miles to the east of where it was before. The bird flew due south, but from the viewpoint of the people on the island, who travel with the Earth, the bird’s flight seemed to curve to the west.
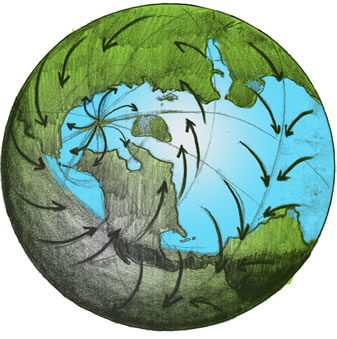
In a similar manner, winds moving southward seem to curve to the west; and winds moving northward curve to the east. The picture on this page shows the prevailing wind patterns over the entire globe. Notice the bands of curving winds. These are the bottoms of convection currents that are pushed to the east or west because of the Earth’s spin. This is an example of a phenomenon known as the Coriolis effect.
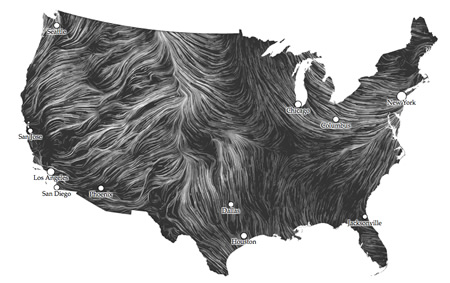
Question 7.3
Looks at the winds in the United States. Which way do they blow?
Notice the two bands of winds in the Atlantic. European sailors called these wind belts the trade winds. They would sail from home ports in Europe down the coast of Africa until the winds blew strongly towards the southwest. These winds would carry them across the Atlantic to the Americas. When they traded the goods they brought with them, and had filled their holds with cotton, tobacco or sugar, they would sail north until they encountered strong winds blowing to the northeast. These winds would carry them back to Europe.
V. Mid-Latitude Cyclones
Weather systems in the United States tend to move from west to east, since that is the direction of prevailing winds. But there are also cold dry winds from the Arctic, and warm winds, filled with water vapor, from the Gulf of Mexico. When warm and cold masses of air meet, they form huge, slowly rotating storm systems called cyclones.
There is a lot of confusion about the word “cyclone,” since some people use it to refer to tornadoes or hurricanes. Meteorologists use the word to refer to a large storm system that can cover several states, and may be as large as 1,000 kilometers in diameter. Thunderstorms that cover a few tens of kilometers can form within cyclones, and tornadoes, which are commonly less than one kilometer in diameter, sometimes form within thunderstorms. So, cyclones are much bigger storm systems.
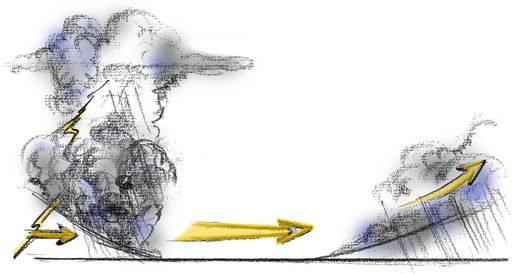
The sketches below show what occurs when warm and cold air masses collide. The direction in which the cold air is moving is shown by dark arrows, and that of the warm air is shown by white arrows.
Remember that warm air is less dense, so it will tend to float upwards when it encounters cold air. Where the warm air mass is pushed into the cold air—called a warm front—it slowly floats upwards, cooling as it goes. The water vapor condenses in the cooling air, just like droplets of water forming on the outside of a pitcher of ice water. Clouds form and the droplets fall as rain.
Where the cold air is pushed into the warm air, it is called a cold front. The warm air is pushed upwards even faster, forming clouds and frequently thunderstorms. If the conditions are just right, dozens of thunderstorms might form along the cold front; and the largest of these may spawn tornadoes.
It takes a day or two for a mid-latitude cyclone to move over a particular location. Suppose you were located a few hundred miles to the south of the center of the cyclone. At first, you would see some high clouds, where the wedge of warm air is pushed far up into the atmosphere.
Then, as the cyclone moved over your location, and you got closer to the warm front, the clouds would lower, and it might rain. When the warm front passed you the temperature would go up a few degrees and the sky would clear. After a few hours—depending on how quickly the storm was traveling—you would see white, fluffy, cumulus clouds to the west, moving in your direction. As the cold front approached, and you felt the leading edge of the cold air wedge, it would get colder again. That is the point at which thunderstorms might form, drenching you with rain, and possibly hail, sleet, or snow. Eventually, as the westward-moving cyclone passed you, the clouds would thin, and you’d see blue sky again.
EF7.2. Investigation: U.S. Wind Maps
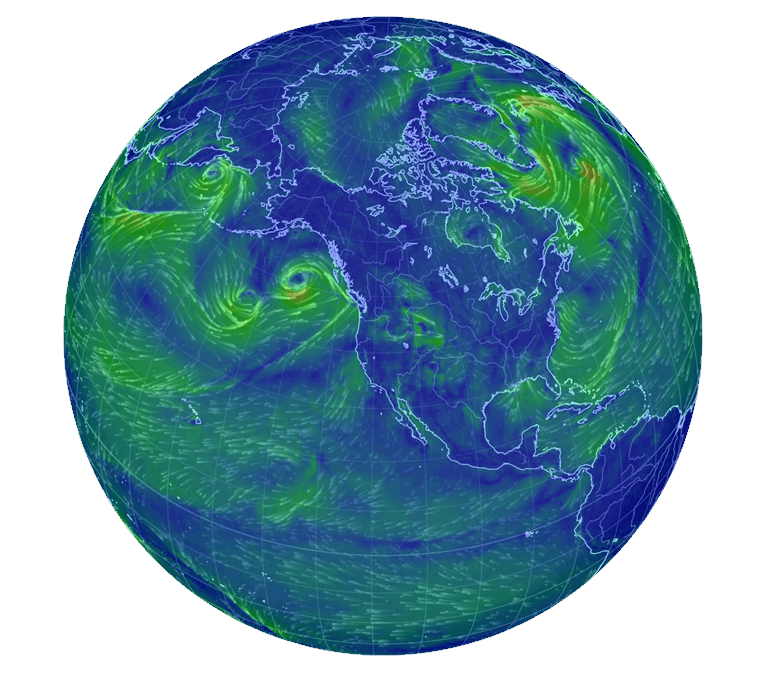
Have a look at the wind map for current day at http://hint.fm/wind, https://www.windy.com or http://earth.nullschool.net. Check it day to day—how does it change? How does it change week to week? Are there patterns that a common or typical?
In the http://earth.nullschool.net/ site, (image below) you can not only display wind speed at any location on Earth, but if you click on the word “Earth” in lower left, you get a control popup that allows you to select Mode (Ocean or Air), Height (in kilopascals pressure), Overlays (for Wind, Temperature, Relative Humidity, Air Density, Wind Power Density, Total Precipitable Water, Total Cloud Water, and Mean Sea Level Pressure), and various Projections. The globe is interactive in that if you click and drag, the globe rotates. With a touch pad interface, you can use two fingers dragging up and down to zoom in or out.
VI. Formation of a Thunderstorm
The Sun’s energy drives worldwide convection currents that cause the hot and cold air masses to collide. A mid-latitude cyclone with its cold front can set the stage for thunderstorms. The difference between the temperature of the air masses determine how violent the storms will be. Let’s follow the Sun’s energy flow all the way from the Gulf of Mexico to a thunderstorm over Oklahoma.
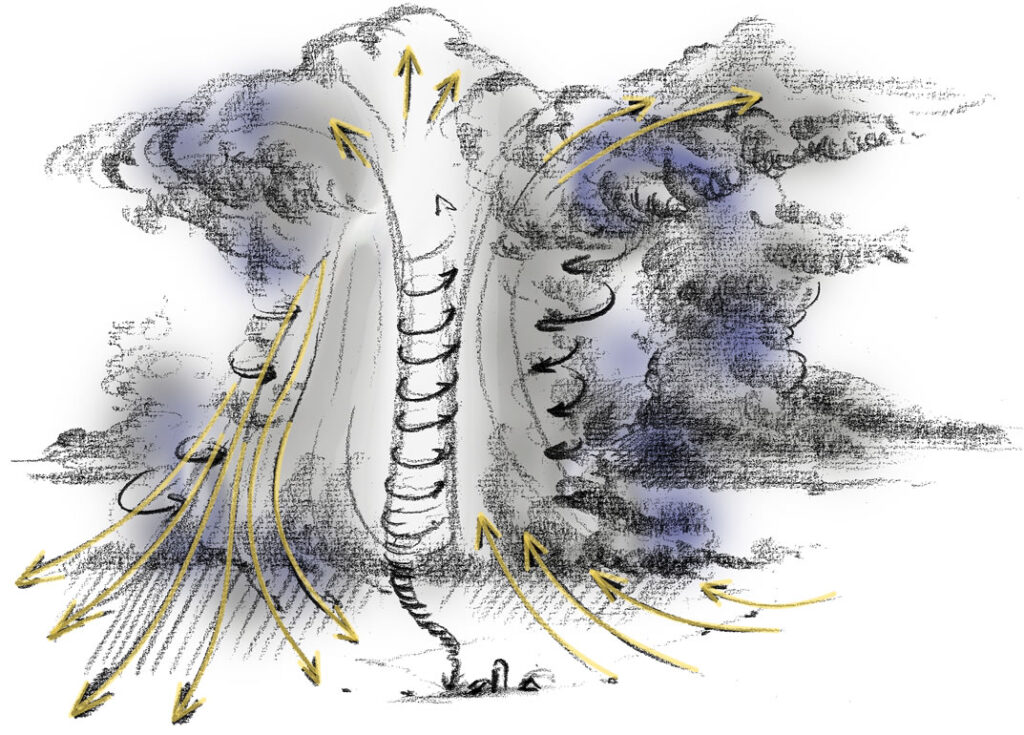
In summer, sunlight is concentrated in the Gulf of Mexico, evaporating huge amounts of water. Warm air masses move northward along the surface from the Gulf of Mexico, picking up tons of water vapor. The hot, moist air moves into the southern and mid-western states, and when it encounters a wedge of very cold air coming south from the Arctic, it is pushed upwards very rapidly, forming strong, vertical winds called updrafts. Cooler air cannot hold as much water vapor as warm air, so water vapor in the updraft condenses into droplets. But wait! Condensation of the water releases the heat that was stored in it from the Sun’s energy evaporating it from the Gulf of Mexico. This heat released in the cloud causes the warm air mass to become even less dense and float upwards even more rapidly.
The updrafts become visible from a distance as rapidly-building clouds that are white at first, then grow darker as they get taller and block off more sunlight. There is a limit to how high the column of clouds can go. The troposphere, the densest part of the atmosphere, closest to the Earth’s surface, extends up about 12 kilometers and contains 95% of the Earth’s atmosphere. It is where all of Earth’s weather occurs. Above the troposphere is the stratosphere, where the air is too thin to support convection—not enough air to exert a very strong force on upward moving masses of air. Fluffy white cumulus clouds in our updraft might push into the stratosphere for a short distance, but then they will flatten out at the top of the troposphere, forming a kind of “anvil” shape, as shown in the picture.
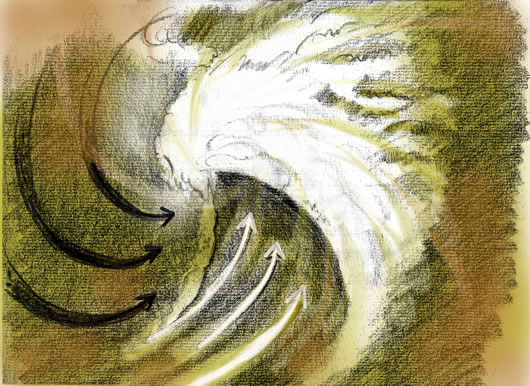
Inside a Thunderstorm
In the center of a thunderstorm is a rising column of air. Air is drawn into the bottom, rises rapidly within the cloud, where it cools, releases its water, and drops down along the sides, forming a local convection current that people on the ground experience as a strong cold wind. The birth of a tornado can happen when the cloud begins to rotate.
Rotation is partly due to the spin of the Earth that we saw when looking at global wind patterns. A mid-latitude cyclone is a very large, slowly rotating storm. Streams of wind within the cyclone, moving at different speeds, can start the rotation of smaller clouds—the size of thunderstorms. Sometimes two or more storms can join together, forming a “superstorm.” The superstorm not only combines the rotational motion of the other storms, it can spin faster and get smaller in diameter, like an ice skater increasing her rate of spin as she brings in her arms.
The rotational motion of a thunderstorm can be increased by surrounding winds which stream around the storm, forcing the outsides of the cloud to spin. The speed of the updraft can be increased by a high altitude wind flow, called the jet stream, that acts like a vacuum cleaner, pulling air up the center of the cloud.
Eventually, a strong rotating column of air, called a vortex, may form near the center of the cloud. Winds with speeds of as much as 100 kilometers per hour (about 60mph) within the vortex spiral upward. Fresh air is sucked into the vortex at the bottom and expelled from the top of the cloud.
VII. Tornadoes
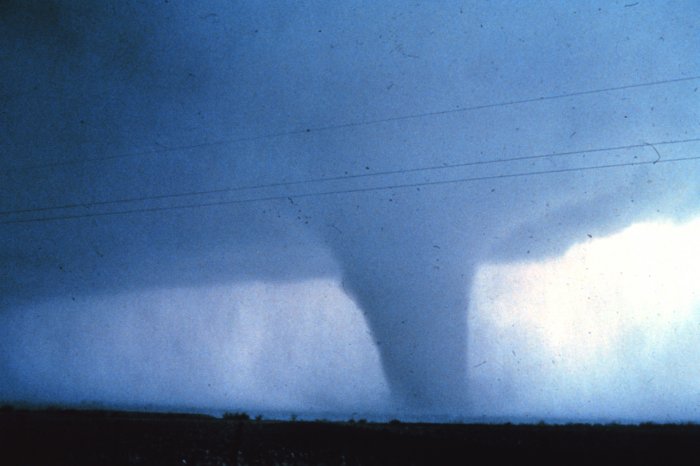
A funnel cloud can form at the bottom of the vortex in a strong thunderstorm. If the funnel reaches down to the surface, it is called a tornado. A tornado is a rapidly-spinning vortex, from 10 to 400 meters in diameter. The small size of the tornado is the key to the tremendous speed of its winds which can exceed 200 kilometers per hour (about 125 mph). Again, think of the ice skater who spins more and more rapidly as she pulls in her arms and becomes a blur of motion. As the funnel cloud extends downward it contracts, and spins faster and faster.
Tornadoes typically last no more than 15 minutes, though they can occasionally last for several hours, and more than one can be generated by a single superstorm.
People who have witnessed tornadoes say that they are usually preceded by rain, hail, and lightning. The tornado itself generates a tremendous roar, and the funnel cloud moves very rapidly in a straight line, or snakes about unpredictably.
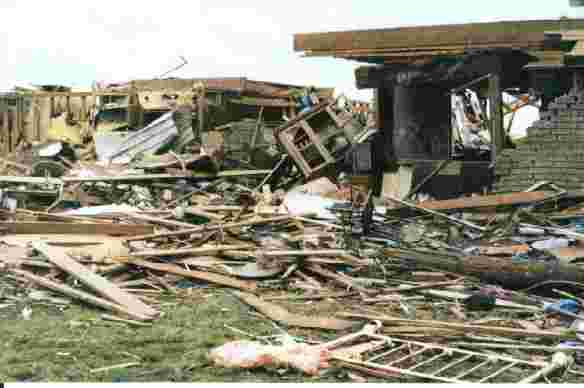
Because of the great updrafts at the centers of tornadoes, they can lift cars, trees, and entire houses high into the air, and hurl them aside with tremendous force. Sometimes, a large tornado contains several mini-twisters, from two to thirty meters in diameter, which move even faster than the large cloud. These can cut a house in half, leaving part of it untouched.
VIII. Conclusion
People who are trying to get to know one another will often “talk about the weather.” But truly, weather is not just “small talk.” It’s a fascinating and complex topic. Though this chapter just skims the surface, certain aspects of the weather should now be clear. For one thing, weather is driven by the Sun’s energy. Rain, snow, sleet, winds, and storms are all caused by radiant energy from the Sun. Because the Earth is a sphere, energy from the Sun heats it unevenly. It is warmer near the equator than near the poles. This uneven heating drives convection currents. We experience the bottoms of convection currents as wind. Because the Earth rotates, wind patterns curve towards the east and west, causing masses of air with different temperatures and moisture content to collide with each other. Colliding air masses spawn huge storm systems, and small but powerful thunderstorms and tornadoes. Weather involves more than the atmosphere. The warming of the land and oceans, and evaporation of water by the Sun play an equally important role.
Another important global weather pattern is described in the next chapter.
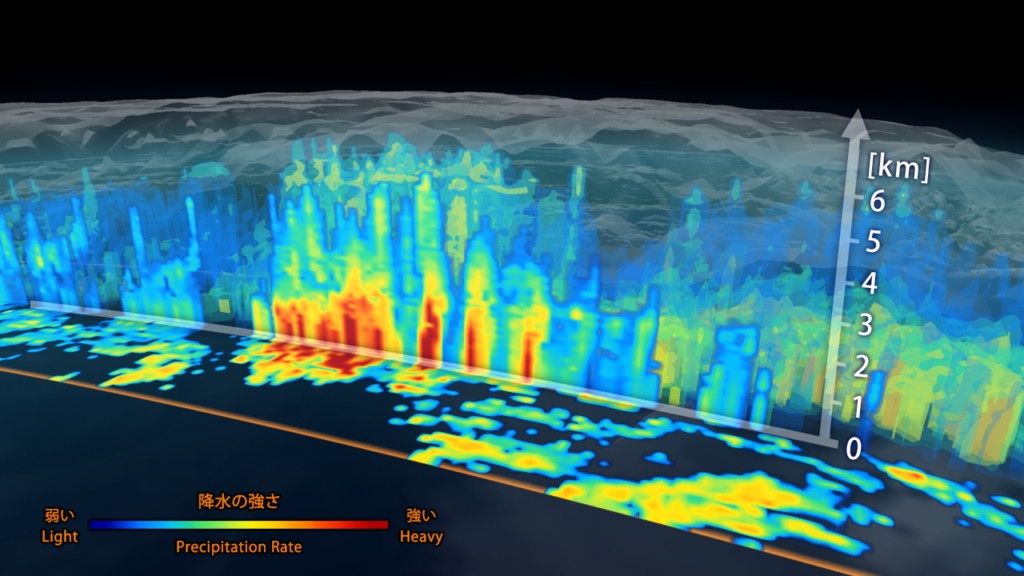
From NASA Release 14-086 (March 2014): NASA and the Japan Aerospace Exploration Agency (JAXA) released the first images captured by their newest Earth-observing satellite, the Global Precipitation Measurement (GPM) Core Observatory…. Cyclones …occur when masses of warm air collide with masses of cold air north or south of the tropics. These storm systems can produce rain, snow, ice, high winds, and other severe weather. In these first images, the warm front ahead of the cyclone shows a broad area of precipitation — in this case, rain — with a narrower band of precipitation associated with the cold front trailing to the southwest. Snow is seen falling in the northern reaches of the storm.
…radar sends signals that bounce off the raindrops and snowflakes to reveal the 3D structure of the entire storm. …One frequency senses heavy and moderate rain. A new, second radar frequency is sensitive to lighter rainfall and snowfall. “Both return independent measurements of the size of raindrops or snowflakes and how they are distributed within the weather system,” said DPR scientist Bob Meneghini at Goddard. “DPR allows scientists to see at what height different types of rain and snow or a mixture occur — details that show what is happening inside sometimes complicated storm systems.”
“All this new information comes together to help us better understand how fresh water moves through Earth’s system and contributes to things like floods and droughts,” said Skofronick-Jackson….